LinkedIn Engagement Rate Benchmark: Is 2% Good?
The tier-by-tier benchmark, measured on 499 LinkedIn profiles, plus the four patterns that matter more than the score itself.
Someone tells you a creator has a 2% engagement rate. Is that good?
Here is the short answer, and it is more useful than the long one: on LinkedIn, 2% is excellent almost everywhere and extraordinary above 50,000 followers. Most people assume the opposite, because 2% sounds like a rounding error next to the numbers thrown around on Instagram and TikTok. LinkedIn does not work like that.
The benchmark, tier by tier
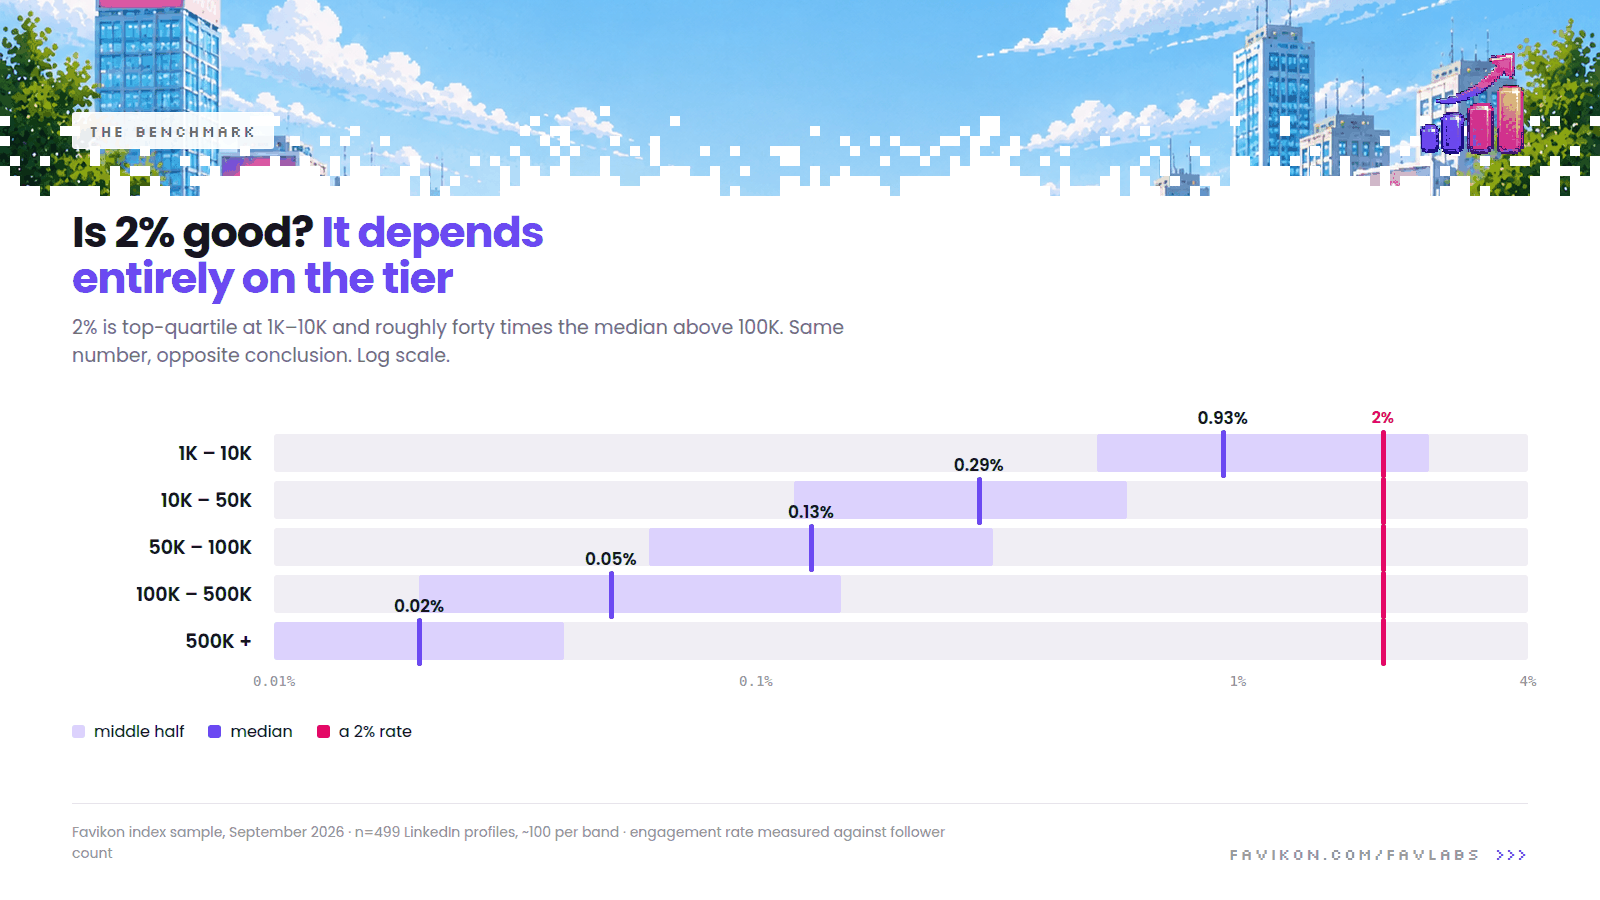
We read the engagement rate on a sample of 499 LinkedIn creator profiles from the Favikon index in September 2026, spread across five follower bands. Median engagement rate by band:
- 1K to 10K followers — 0.93% median. Half of this band sits between 0.51% and 2.49%.
- 10K to 50K — 0.29% median, most between 0.12% and 0.59%.
- 50K to 100K — 0.13% median.
- 100K to 500K — 0.05% median.
- 500K and above — 0.02% median.
So: a 2% rate on 3,000 followers puts a creator in the top quarter of their band. The same 2% on 300,000 followers would put them roughly forty times above their band median, which in practice means you should check the numbers rather than celebrate them.
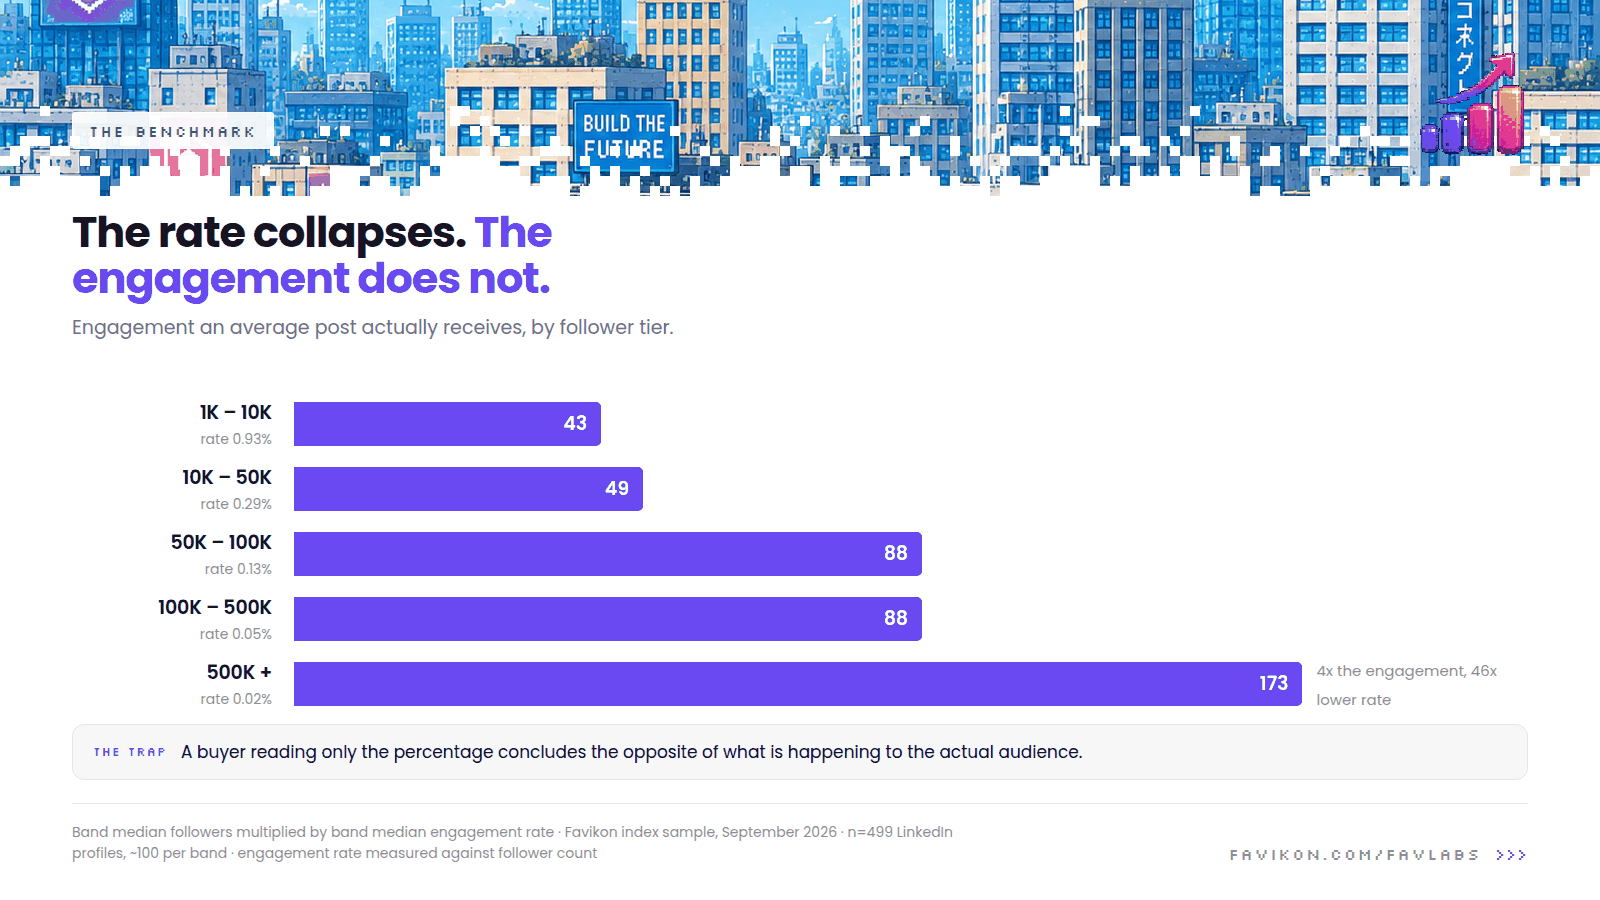
The pattern underneath is the one worth internalising. Engagement rate falls by roughly an order of magnitude between the smallest band and the largest. Judging a 200,000-follower account against a generic "good engagement is 2%" rule of thumb is how buyers talk themselves out of the strongest creators on the platform.
Why the number drops so hard
Three things compound as an audience grows, and none of them mean the creator got worse.
- Follower counts do not decay. Nobody unfollows. The denominator keeps growing long after the people in it stopped reading.
- Distribution is capped. A post does not reach a million people because a million people follow you. Engagement rate measured against followers measures an audience that was never shown the post.
- Seniority suppresses public engagement. A senior B2B audience reads without commenting. Plenty of them will not like a post a competitor might notice. The attention is real; it is just silent.
That last one is why a LinkedIn expert with a modest rate and a room full of decision-makers is often the better buy than a higher-rate creator whose audience is other creators.
Four patterns worth more than the number itself
Once you have placed the rate against the right band, stop looking at the score and look at the shape.
- Comments versus likes. Likes are cheap and easy to buy. Comments that respond to the actual argument in the post are hard to fake. A high rate carried entirely by likes deserves a second look.
- Consistency across posts. One viral post inside an otherwise flat feed inflates the average. You are buying the median post, not the outlier.
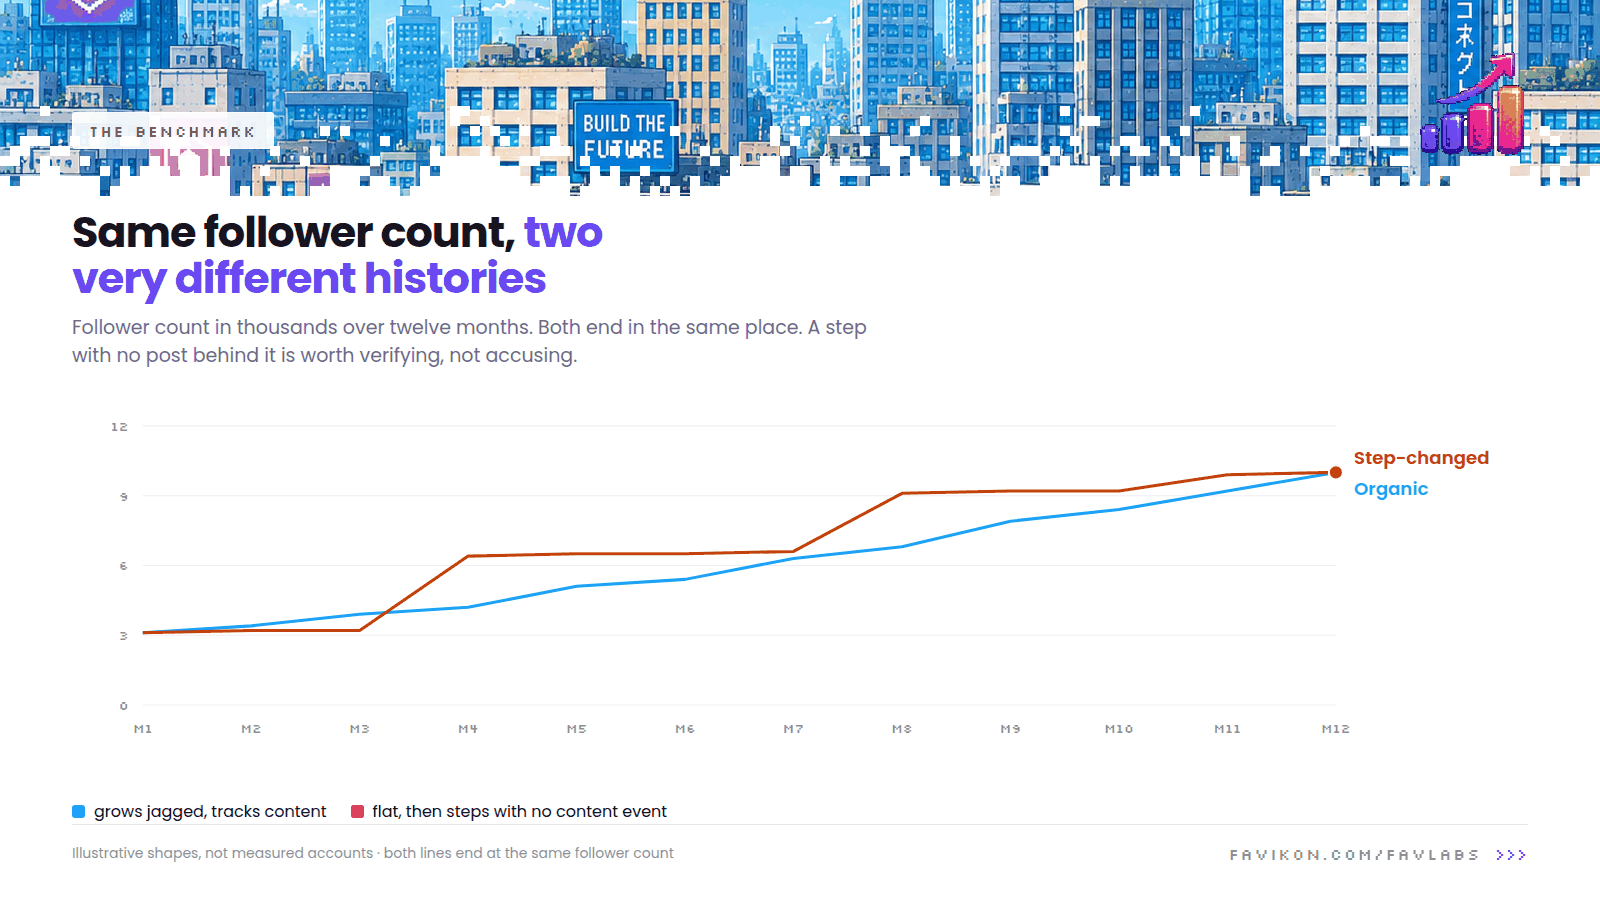
- Growth curve shape. Real audiences grow in a jagged line. Clean step-changes with no corresponding content event are worth verifying.
- Do the numbers move together? When followers climb and engagement stays flat in absolute terms, the new followers are not paying attention. That is the clearest tell there is.
What the rate tells you about the price
Engagement is one half of a two-part question. The other half is what you are paying for it.
Across the same bands, cost per engagement on LinkedIn runs roughly flat from 1K to 500K followers, somewhere between $6 and $12, then jumps to around $33 above 500K. That is the number that should drive a shortlist, not the raw rate and not the raw fee. Our price calculator handles the other half.
What a low score does not mean
A weak engagement rate is a reason to ask a question, not an accusation. Posting cadence, a recent format change, an audience in a different time zone, a month of travel, all of these move the number. A creator who posts twice a week to an audience of buyers is not underperforming a creator who posts daily to an audience of peers, whatever the percentages say.
Treat every flag as "worth verifying" rather than as a verdict, and you will make better calls than someone reading the same dashboard as a scoreboard. You will also have better conversations with creators, who can usually explain a dip in one sentence if you ask instead of assuming.
When you outgrow a spot check
Checking one creator by hand takes a minute. Checking forty takes an afternoon, and by candidate thirty you stop looking properly. Favikon's Authenticity Score runs these same checks automatically across content patterns, comment quality and growth curves, so a shortlist arrives already screened rather than waiting on you to screen it.
Figures above come from a September 2026 sample of the Favikon index: 499 LinkedIn profiles, roughly 100 per follower band. Engagement rate is measured against follower count, which is the convention most media kits use.
Others Tools