How to Build an Influencer Marketing Report: Complete Guide
Looking to build an influencer marketing report that leadership can act on? This guide covers the right metrics, executive summary structure, creator performance breakdowns, reporting cadence, and common mistakes to avoid.


Your campaign just wrapped. Someone in Slack is already asking how it went. You've got a folder of creator screenshots, a GA4 tab you haven't opened yet, and a spreadsheet that makes sense only to you.
That's where most programs lose their next budget cycle. The campaign performed, but influencer campaign reporting didn't, and leadership cut the spend.
An influencer marketing report isn't a data dump. It's an argument that your program worked, deserves to continue, and should be funded again. Know who the report is for before you pull a single metric. That choice shapes everything else in the document.
This guide gives you the full structure, a copy-paste executive summary template, and the metric logic to make that case clearly. Whether you're presenting to your own team or walking a CMO through the numbers, the structure here adapts.
TL;DR: How to Build an Influencer Marketing Report
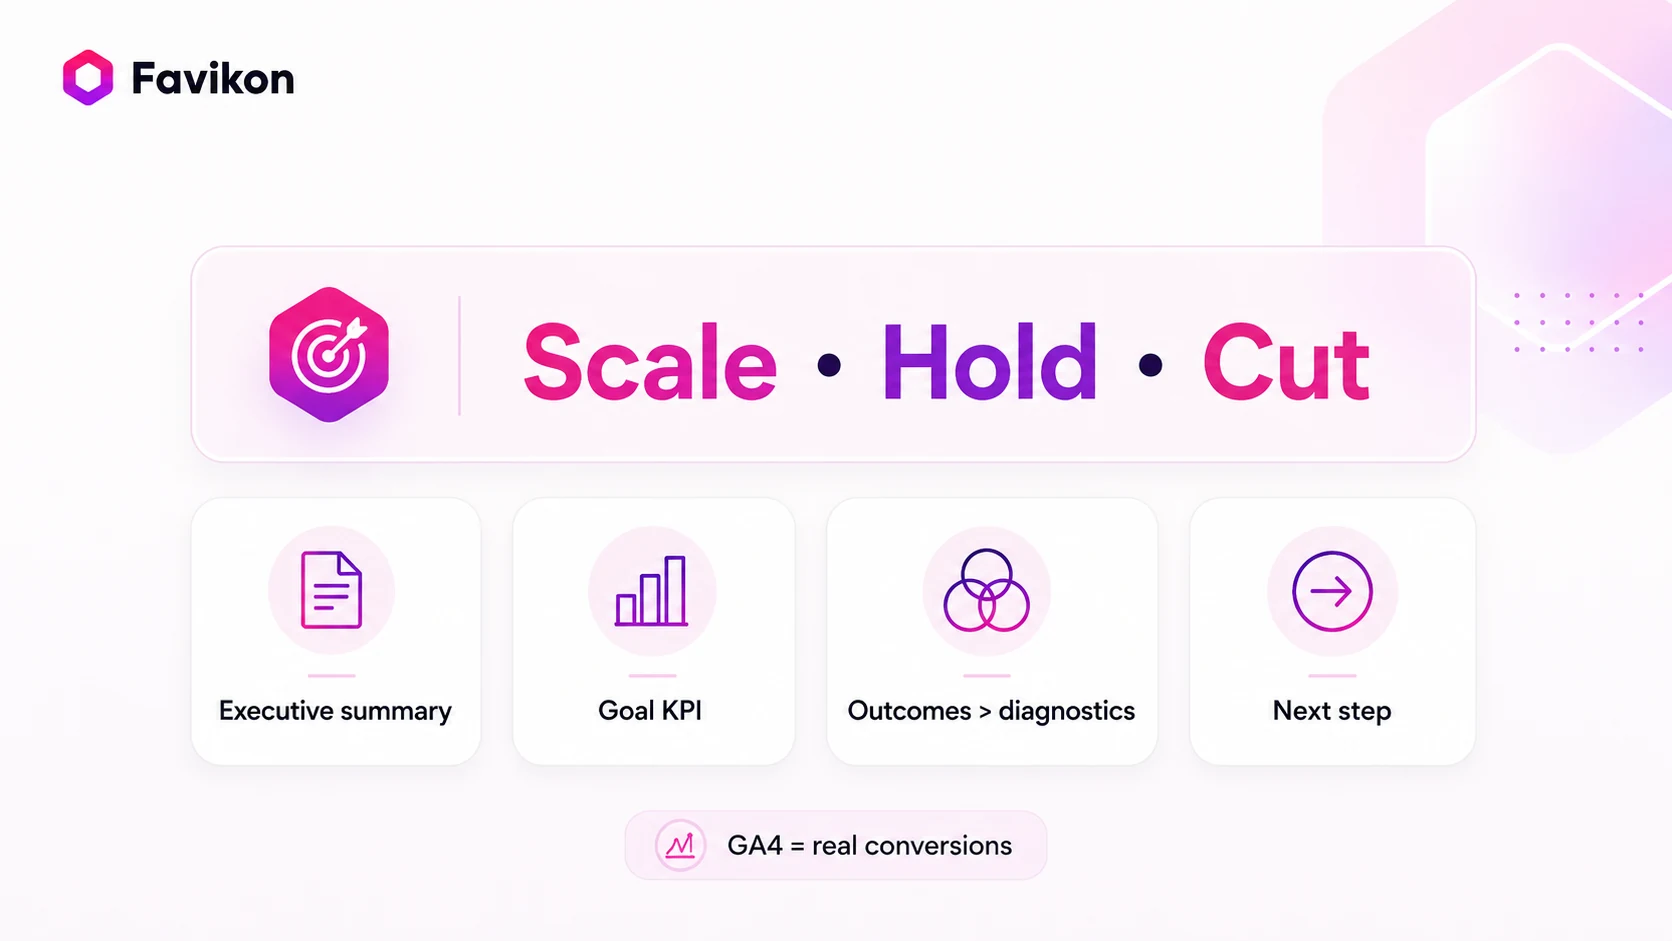
- A good influencer marketing report answers one decision: whether to scale, hold, or cut the program.
- Every report needs, at a minimum, an executive summary, a headline KPI tied to the campaign goal, a creator breakdown, and a clear next step.
- Leading with reach or EMV as the headline metric is the fastest way to lose credibility with a leadership audience.
- Who reads the report determines what goes in it. A team-facing report and a leadership-facing report are not the same document.
- Outcome metrics (revenue, conversions, trial signups) belong in the headline. Diagnostic metrics (reach, engagement rate, CTR) belong in the supporting section or appendix.
- Start a free 7-day trial to connect your GA4 account and track conversions by creator →
What Is an Influencer Marketing Report?
An influencer marketing report is a structured summary of how a campaign or program performed against a stated goal, built for a specific audience. It takes creator screenshots, GA4 numbers, and campaign spend, and turns them into one clear answer: did this work, and what should happen next? It's not a folder of screenshots or a raw data export someone has to interpret on their own.
Say you ran a trial-signup campaign with 15 creators over six weeks. A report isn't just a list of follower counts and engagement rates for each one. It's showing that the campaign drove 340 tracked trial signups against a target of 250, naming which three creators drove most of that, and recommending you rebook them for the next round.
The audience shapes the document as much as the data does. A report built for your own team focuses on what to tweak week over week, like posting times or which content format is landing. One built for a CMO focuses on whether the program earned its budget: same underlying numbers, completely different document.
Favikon's campaign tool pulls creator data, GA4 conversions, and spend into one place, so this doesn't take two days to assemble by hand.
Why Influencer Marketing Reporting Matters
The direct cost of a weak report isn't a bad grade. It's a frozen budget. Leadership doesn't cut programs because they underperformed. They cut programs they can't evaluate. If the numbers are ambiguous, the default is to stop spending until someone makes a clear case.
A structured influencer reporting program is also how campaigns become programs. A one-off campaign with no structured output is just spent. A campaign with a report that shows what worked, which creators to rebook, and what the next round should look like becomes a repeatable strategy. That's the difference between a test and a channel.
Decide Who the Report Is for Before You Build It
Most influencer marketing reports get built the wrong way. You pull the numbers first, then figure out how to present them. That produces a data dump.
The better approach is to start with the decision the report needs to support. Leadership is usually weighing one of three things. Scale the program and increase the budget, hold it at current spend while watching a few more data points, or cut it and reallocate elsewhere. A report that doesn't address one of those directly is harder to act on, no matter how detailed it is.
A few practical rules before you open a single spreadsheet:
- A team-facing report and a leadership-facing report are not the same document. Build them separately.
- The exec version should answer "so what do we do?" on the first page.
- Define the decision the report needs to support before picking your metrics. The metrics exist to support the argument.
Pick Metrics That Match the Goal
The fastest way to undermine an otherwise solid campaign is to report the wrong metric for the goal. If you run a conversion campaign and the headline number is reached, leadership sees a mismatch. If you ran an awareness play and you're reporting cost per acquisition, you're measuring something the campaign was never designed to do.
Earned media value (EMV) deserves a specific mention here. It estimates what your earned exposure would have cost as paid media, using ad rate benchmarks for your channel and content format. It's a useful directional comparison, but it doesn't measure anything the campaign actually produced. It belongs in an appendix as a reference number. It should not lead to the executive summary.
Here's how to match metrics to what the campaign was actually for:
Separate What the Campaign Proved from What Explains Why
Outcome metrics answer one question. “Did it work?”
These are the numbers that belong in your headline: revenue attributed, trials started, qualified leads generated, tracked conversions. This is what leadership judges when deciding whether to renew the program.
Diagnostic metrics answer a different question. Why did it work, or why didn't it? Reach, engagement rate, click-through rate, content quality, and creator responsiveness explain the mechanism behind the outcome. Engagement rate is particularly useful because it tells you whether the audience was genuinely responsive to the content.
That distinction matters when you're deciding which creators to rebook. These metrics belong in a second section or an appendix. Mixing both into the same headline makes the report read like a data export rather than a story. Lead with outcomes. Show the work underneath.
Collect the Data Without Chasing Every Creator for Screenshots
Manual data collection is the part that eats up the most time in a full reporting cycle. You message creators and wait, sometimes a week, for screenshots that show up cropped differently every time. Nothing is verifiable, and you spend two days aggregating numbers into a spreadsheet that still can't tell you who drove the actual conversions.
UTM parameters help you tag each creator's link so GA4 can separate their traffic from everything else. The problem is that UTMs only work if every creator uses their exact link, without shortening or swapping it, which doesn't always happen.
Past roughly 20 active creators, you're also jumping between GA4, your affiliate dashboard, Shopify's marketing reports, and a spreadsheet. Shopify will show you which sessions converted, but it won't cleanly tie that to a specific creator unless your tracking setup is airtight.
Pulling all of it into a single coherent view takes most of the time you should spend on analysis.
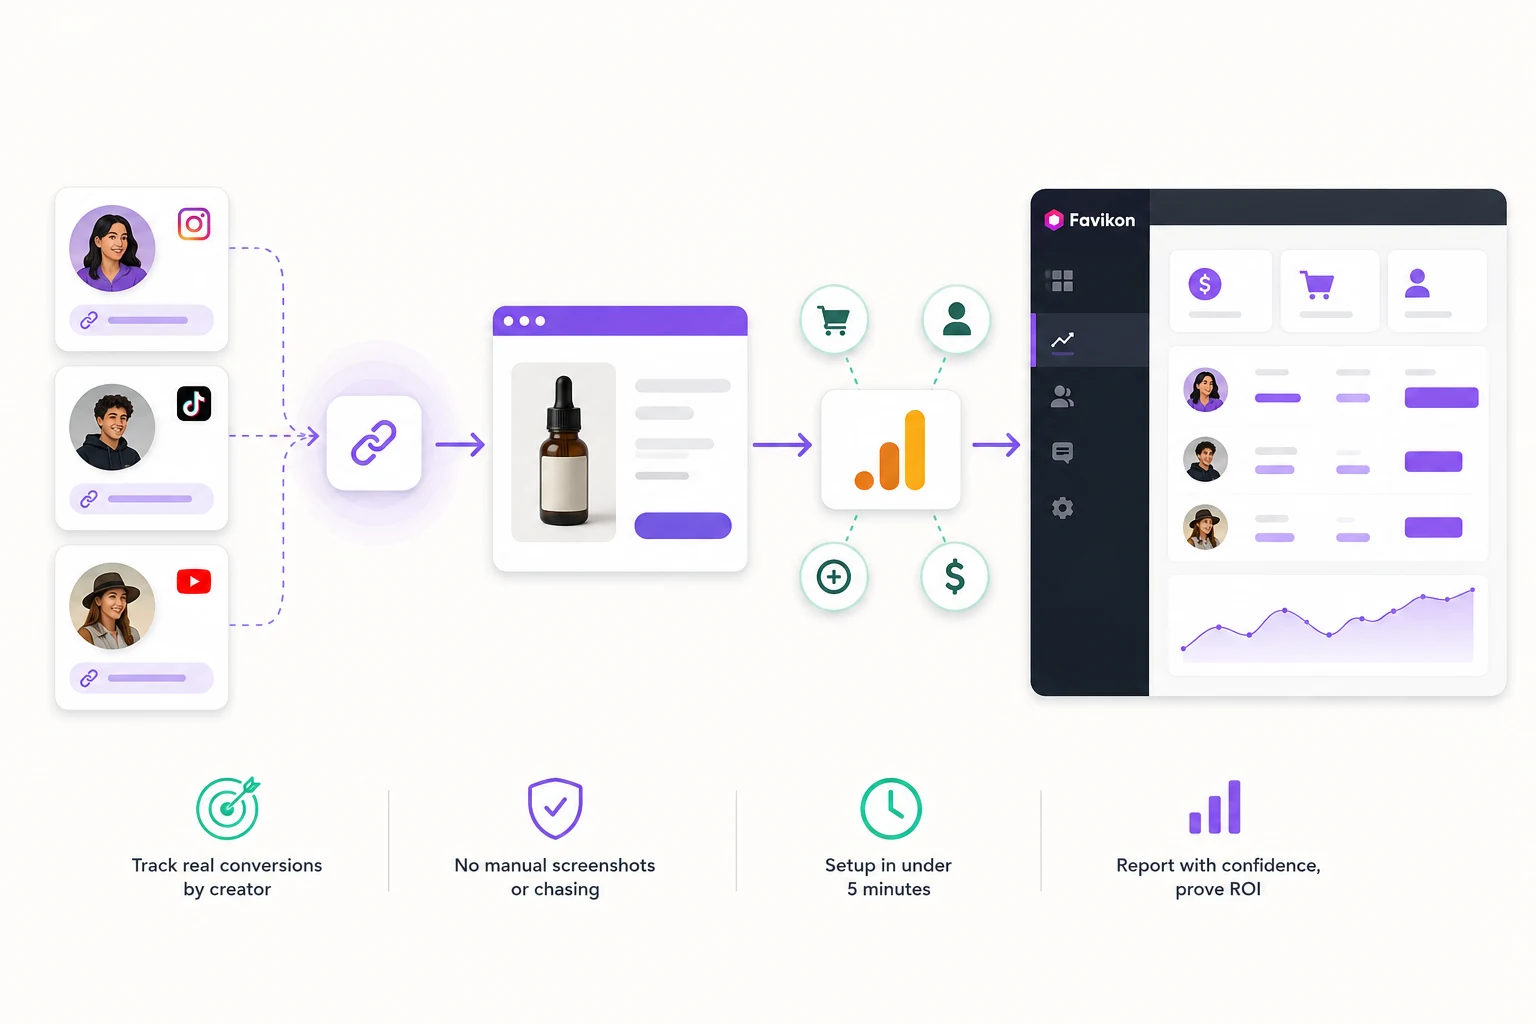
This is where dedicated influencer campaign reporting tools earn their keep. Favikon's GA4 integration connects your campaign directly to your existing Google Analytics property so you can track real conversion events by creator.
It's a Pro-tier feature, so you'll need the Pro plan ($299/month, or $239/month billed annually) or above to access it. The setup takes a few minutes inside your campaign settings:
- Go to your campaign settings and open the Tracking tab.
- Connect your GA4 account and select the correct property.
- Set your destination URL, the landing page where creators will send traffic.
- Add the conversion events you want to track: purchases, demo signups, add-to-cart, or whatever your developers have already configured in GA4. These are the key events that signal a user completed a meaningful action, as opposed to just visiting the page.
- Choose a primary conversion event, the one metric that actually measures campaign success.
- Generate unique tracking links per creator via Creator Chat, under Collab Info, so each creator's contribution is tracked individually.
From there, monitor performance under Performance → Analytics, with each creator's conversion data broken out separately. Export the CSV to calculate ROI per creator without any manual aggregation.
Other tools handle attribution differently. Some use their own tracking links and discount codes rather than connecting to your existing GA4 setup. Both approaches work. The advantage of a GA4-native connection is that the data lands in the same property you're already using for the rest of your marketing reporting, so comparisons are clean.
Build the Executive Summary First
Most reports bury the executive summary at the end or leave it out entirely, letting the data speak for itself. Neither works well for a leadership audience.
The exec summary is the first thing they read and often the only thing they read in full. It needs to answer the decision on one page: what the goal was, what happened, and what this means for next steps. If someone has to ask, "So what should we do?" After reading it, the summary isn't done.
Write it first. That forces clarity about what the campaign actually proved before you spend time formatting the supporting data. Here's the structure:
Structure the Rest of the Report
Once the executive summary is in place, the rest of the report adds context that supports its conclusions rather than introducing new arguments. The structure below works for most campaign types and scales cleanly whether you're presenting to a team or a leadership audience.
Here's the order that holds up:
- Campaign overview: The objective, timeline, total budget, and creator count. Two to three sentences. This is context.
- Performance summary: Your headline metric against target, plus four to five supporting KPIs. Include a brief line on what each number means.
- Creator breakdown: Which creators hit their goals and which didn't. Evaluate this over a long enough window that one slow week doesn't tank a good long-term partner. This section feeds your rebooking decisions.
- Content highlights: The top-performing posts and any compliance flags. Influencer brand deal reporting should always include disclosure status. A missing FTC disclosure is a workflow signal worth surfacing. The FTC's guidelines are specific: disclosures need to be clear, conspicuous, and placed where a viewer will see them before engaging with the content.
- Learnings and next steps: Two to three concrete changes for the next campaign. "Continue monitoring" is not a finding. "Shift budget from X creator segment to Y because Z" is.
How Often to Report
The right cadence depends on how you're using the data. A weekly internal check-in works for the team but is too noisy for leadership, since a single week of content volume tells you almost nothing about program health.
Here's how most teams split it:
Weekly: Internal team check-ins. Good for catching execution issues early.
Monthly: Mid-program course corrections, the right cadence for catching a creator who's consistently underperforming before the contract ends.
Quarterly: The version leadership sees. Quarterly smooths out single-month variance and gives you enough data to make defensible budget recommendations.
What shifts the cadence: program size (a 50-creator always-on program needs more frequent check-ins than a 5-creator seasonal test), and how the rest of your marketing team already reports to leadership. If the rest of the team is on a quarterly reporting cycle, matching that rhythm makes your numbers easier to compare.
Mistakes That Undercut an Otherwise Good Report
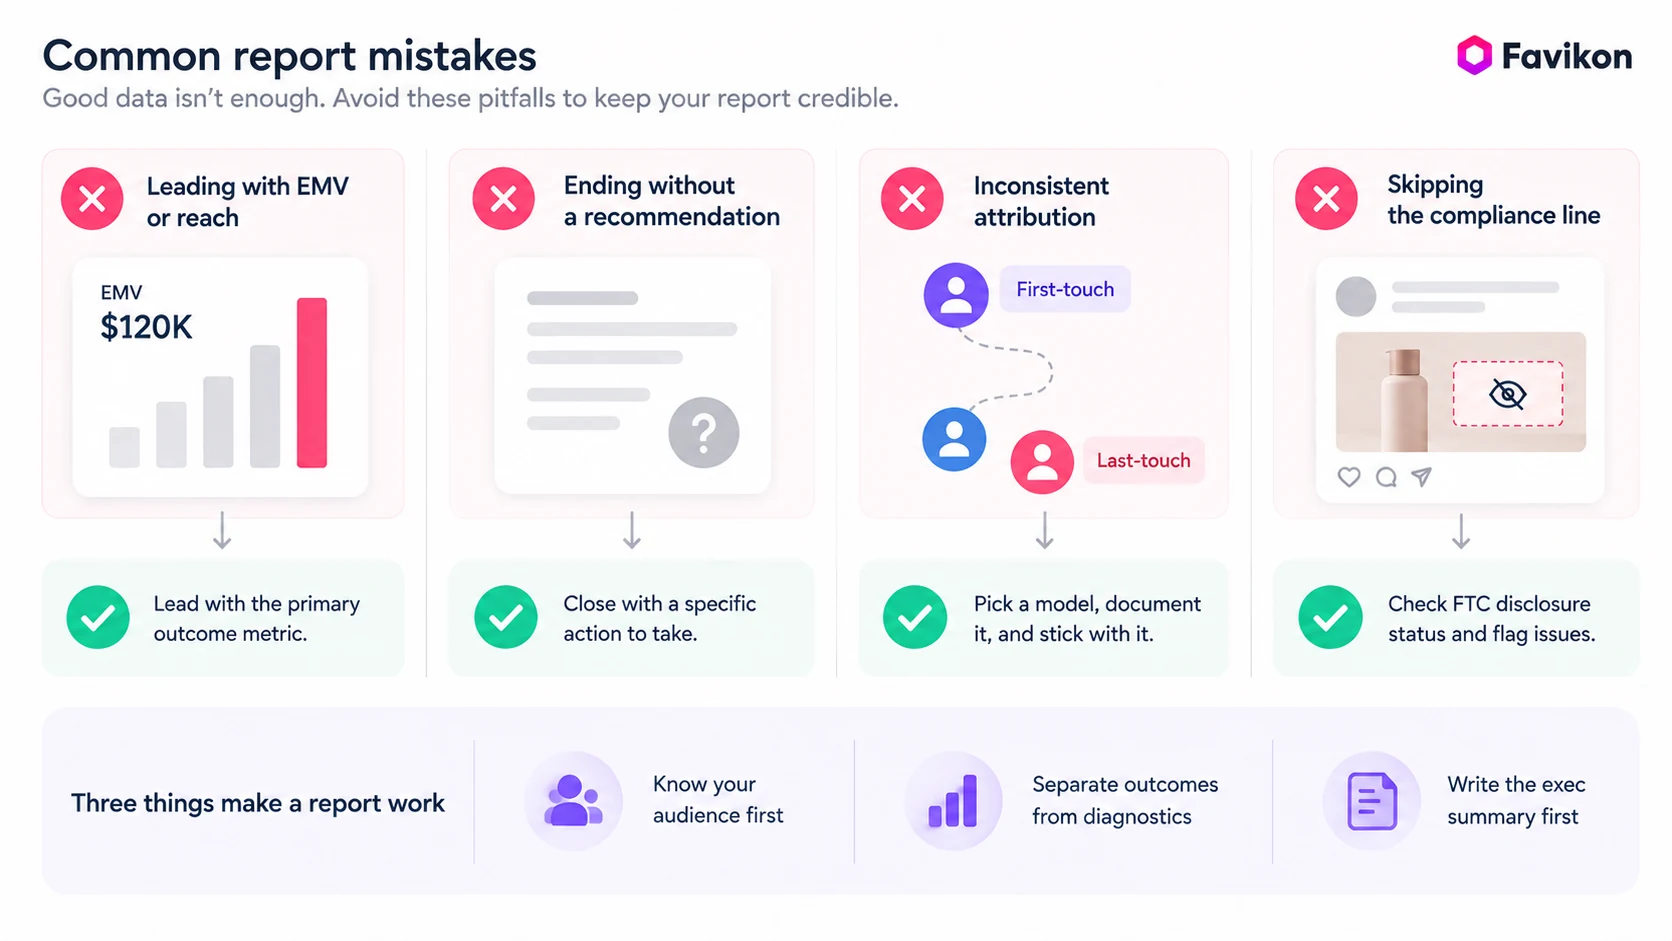
Four patterns recur in reports that lose credibility, even when the underlying campaign data is solid.
- Leading with EMV or reach as "the number": EMV tells leadership what exposure would have cost as paid media. It doesn't tell them what the campaign produced. Lead with the primary outcome metric and put EMV in the appendix, if you include it at all.
- Ending without a recommendation: "Continue monitoring" is not a decision. A report that closes on data but no recommendation puts the burden back on leadership, and they'll often default to pausing spend until someone makes the call. Always close with a specific action you're recommending.
- Inconsistent attribution between reporting periods: First-touch gives all credit to the creator who introduced the buyer. Last-touch gives it to whoever they engaged with right before converting. Neither is wrong, but switching between them mid-program makes your month-over-month comparison meaningless. Pick a model, document it in the report, and stick with it across every period.
- Skipping the compliance line: A missing FTC disclosure in a creator's post is a workflow issue if your team is running campaigns without checking disclosure status; that belongs in the report as a process flag.
If you're still manually pulling creator data or estimating conversions via EMV, that's worth fixing before the next campaign. Connect your GA4 account inside the campaign tracking setup (Pro plan required). The attribution data you get back is the kind that holds up when someone asks a follow-up question.
Frequently Asked Questions
How Do I Report Influencer Marketing ROI to Executives?
To report influencer marketing ROI to executives, lead with a one-page executive summary: the campaign goal, the primary outcome against target, and one specific recommendation (scale, hold, or cut). Leadership doesn't need every metric. They need a decision. See Favikon's guide to measuring influencer marketing ROI for the calculation itself.
What Should Be Included in an Influencer Marketing Report?
An influencer marketing report should include an executive summary, campaign overview, performance summary against the goal, creator breakdown, compliance flags, and a learnings section with a concrete next step. Which metrics appear depends on whether the goal was awareness, traffic, or conversion. Match them to the goal first.
How Often Should You Report on Influencer Marketing?
How often you report on influencer marketing depends on who's reading it. Weekly works for internal team check-ins, monthly lets you catch underperforming creators before the contract ends, and quarterly is the version leadership sees. Quarterly smooths out variance and gives you enough data for defensible budget recommendations. Larger programs often need monthly executive updates rather than quarterly ones.
Is EMV a Good Metric to Put in Front of Executives?
It depends. EMV isn't reliable on its own for executives, since it estimates what your exposure would've cost as paid media, not what the campaign actually produced. Use it as a directional reference in an appendix instead. The headline number in an executive report should always be a real outcome, like revenue or signups.
How Do I Automate Influencer Marketing Reporting?
To automate influencer marketing reporting, start with tools that offer direct GA4 integration, since they automatically track conversions by creator. Once your creator roster grows, manual reporting stops scaling; at that point, direct GA4 integration becomes the practical path. Favikon's campaign management generates unique tracking links per creator and pulls attribution data without manual aggregation.
What's the Difference Between a Campaign-Level and Creator-Level Report?
The difference between a campaign-level and creator-level report comes down to the question each one answers. Campaign-level reporting answers whether the overall effort worked: total reach, aggregate conversions, ROI across the program. Creator-level reporting answers which individual partners to rebook. One slow week doesn't disqualify a good partner, so evaluate over time.
Others articles