How to Track Employee Social Media Performance on LinkedIn
Employee content can play a major role in building brand visibility and trust on LinkedIn. This guide explains how to measure performance, monitor key metrics, and evaluate the impact of employee advocacy.
.png)

How to Track Employee Social Media Performance on LinkedIn (Without an Advocacy Platform)
You have ten, twenty, maybe fifty people posting on LinkedIn for the company. Your current reporting is a screenshot of the LinkedIn “My Company” tab and a headcount of how many people posted this month. You don’t know which employee is actually driving reach. You don’t know whose following is growing. You can’t tell whose posts are performing above average and whose are invisible.
That’s a participation metric. It tells you who showed up, not how well they did. For most marketing teams, it’s the only number they have.
The reframe this article is built on: your employees are LinkedIn creators. The engineers, founders, sales leads, and marketers posting on behalf of your brand have follower counts, engagement rates, Authority Scores, and posting consistency — the same variables you’d measure for any external influencer. They should be tracked the same way. This guide shows you how to build that tracking system using Favikon’s influencer analytics platform, without deploying a dedicated advocacy platform.
1. Why LinkedIn’s Native Advocacy Analytics Aren’t Enough
LinkedIn provides two data points for employee advocacy programs. The “My Company” tab shows recommendation reshares — how many employees reshared a post the company published. LinkedIn analytics shows employee-driven impressions for posts tagged with the company page. That’s it.
Neither tells you:
• Which employees have the largest or fastest-growing LinkedIn audiences
• Whose posts generate above-average engagement relative to their follower count
• Which employee’s content is driving EMV (Earned Media Value) for the brand
• Who is posting consistently versus sporadically
• How an employee’s LinkedIn Authority Score has changed over the past 90 days
The fundamental limitation: LinkedIn’s tools measure content distribution (did it get shared?) not content influence (did it move anyone?). Participation rate as a KPI answers the wrong question.
Every competing advocacy platform — Sociabble, Hootsuite Amplify, Oktopost — measures the same thing: how many employees reshared company content. None measures the independent influence of each employee as a LinkedIn creator in their own right. That’s the gap Favikon fills.
2. The Metrics That Actually Matter for Employee LinkedIn Performance
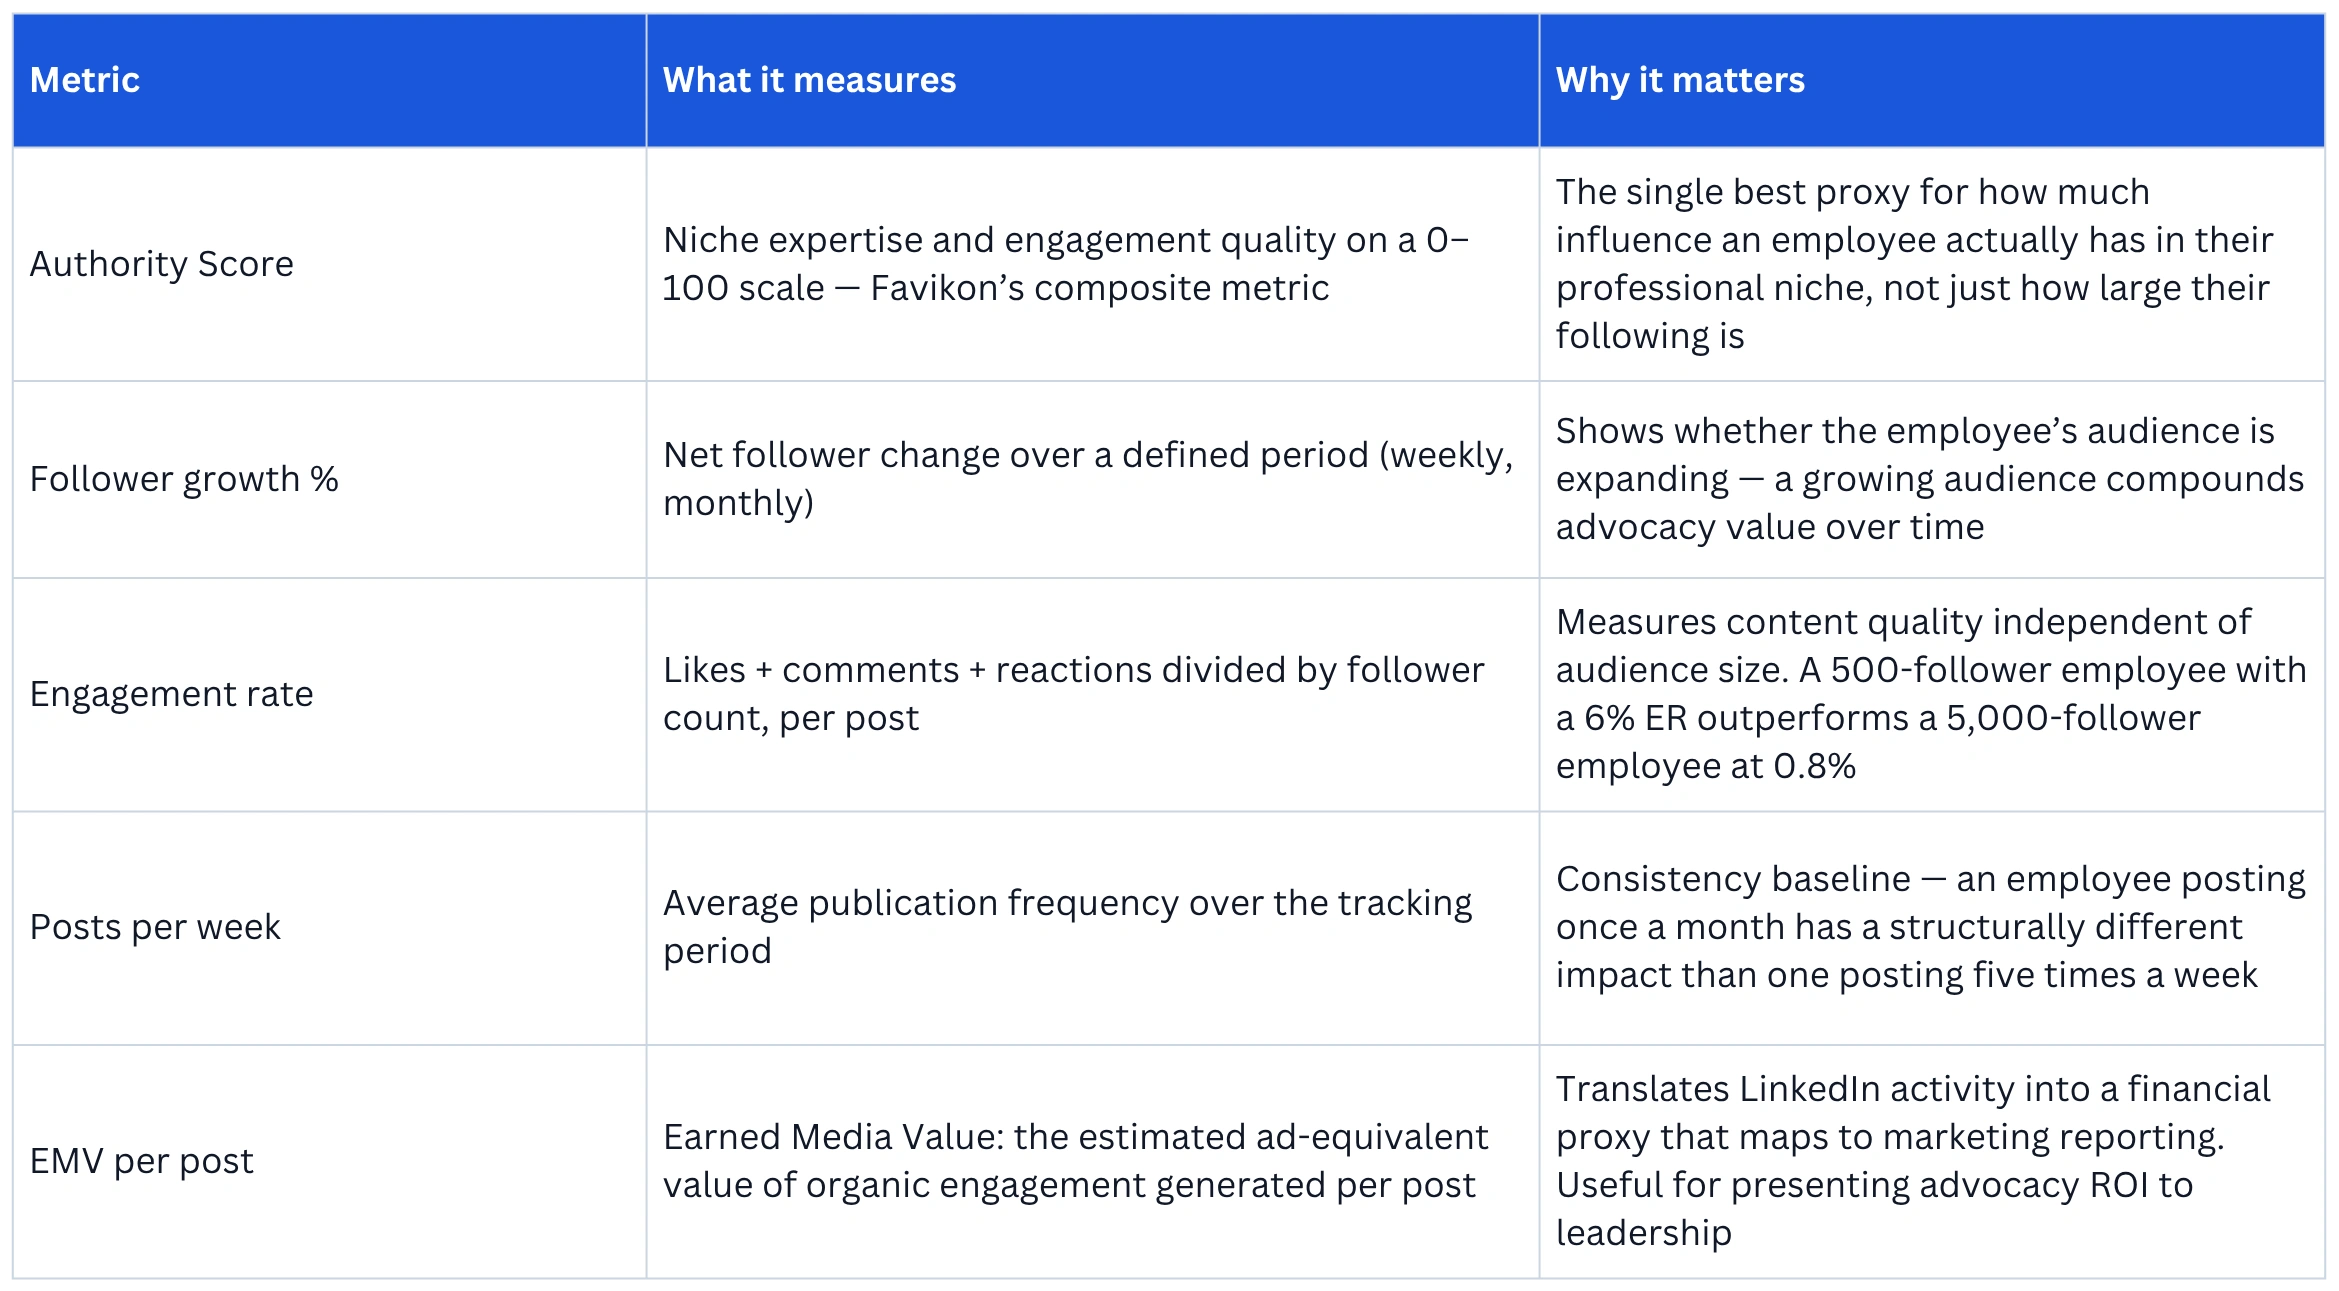
Before setting up the tracking system, it’s worth establishing what you’re measuring and why. These are the five metrics that turn employee LinkedIn activity into a reportable, comparable dataset.
3. How to Set Up an Employee Influencer Tracker in Favikon
This is the core workflow. It takes under 15 minutes to set up for a team of any size, and produces a ranked By Creator view showing every employee’s LinkedIn performance metrics side by side.
Step 1: Create a dedicated List for your employee roster
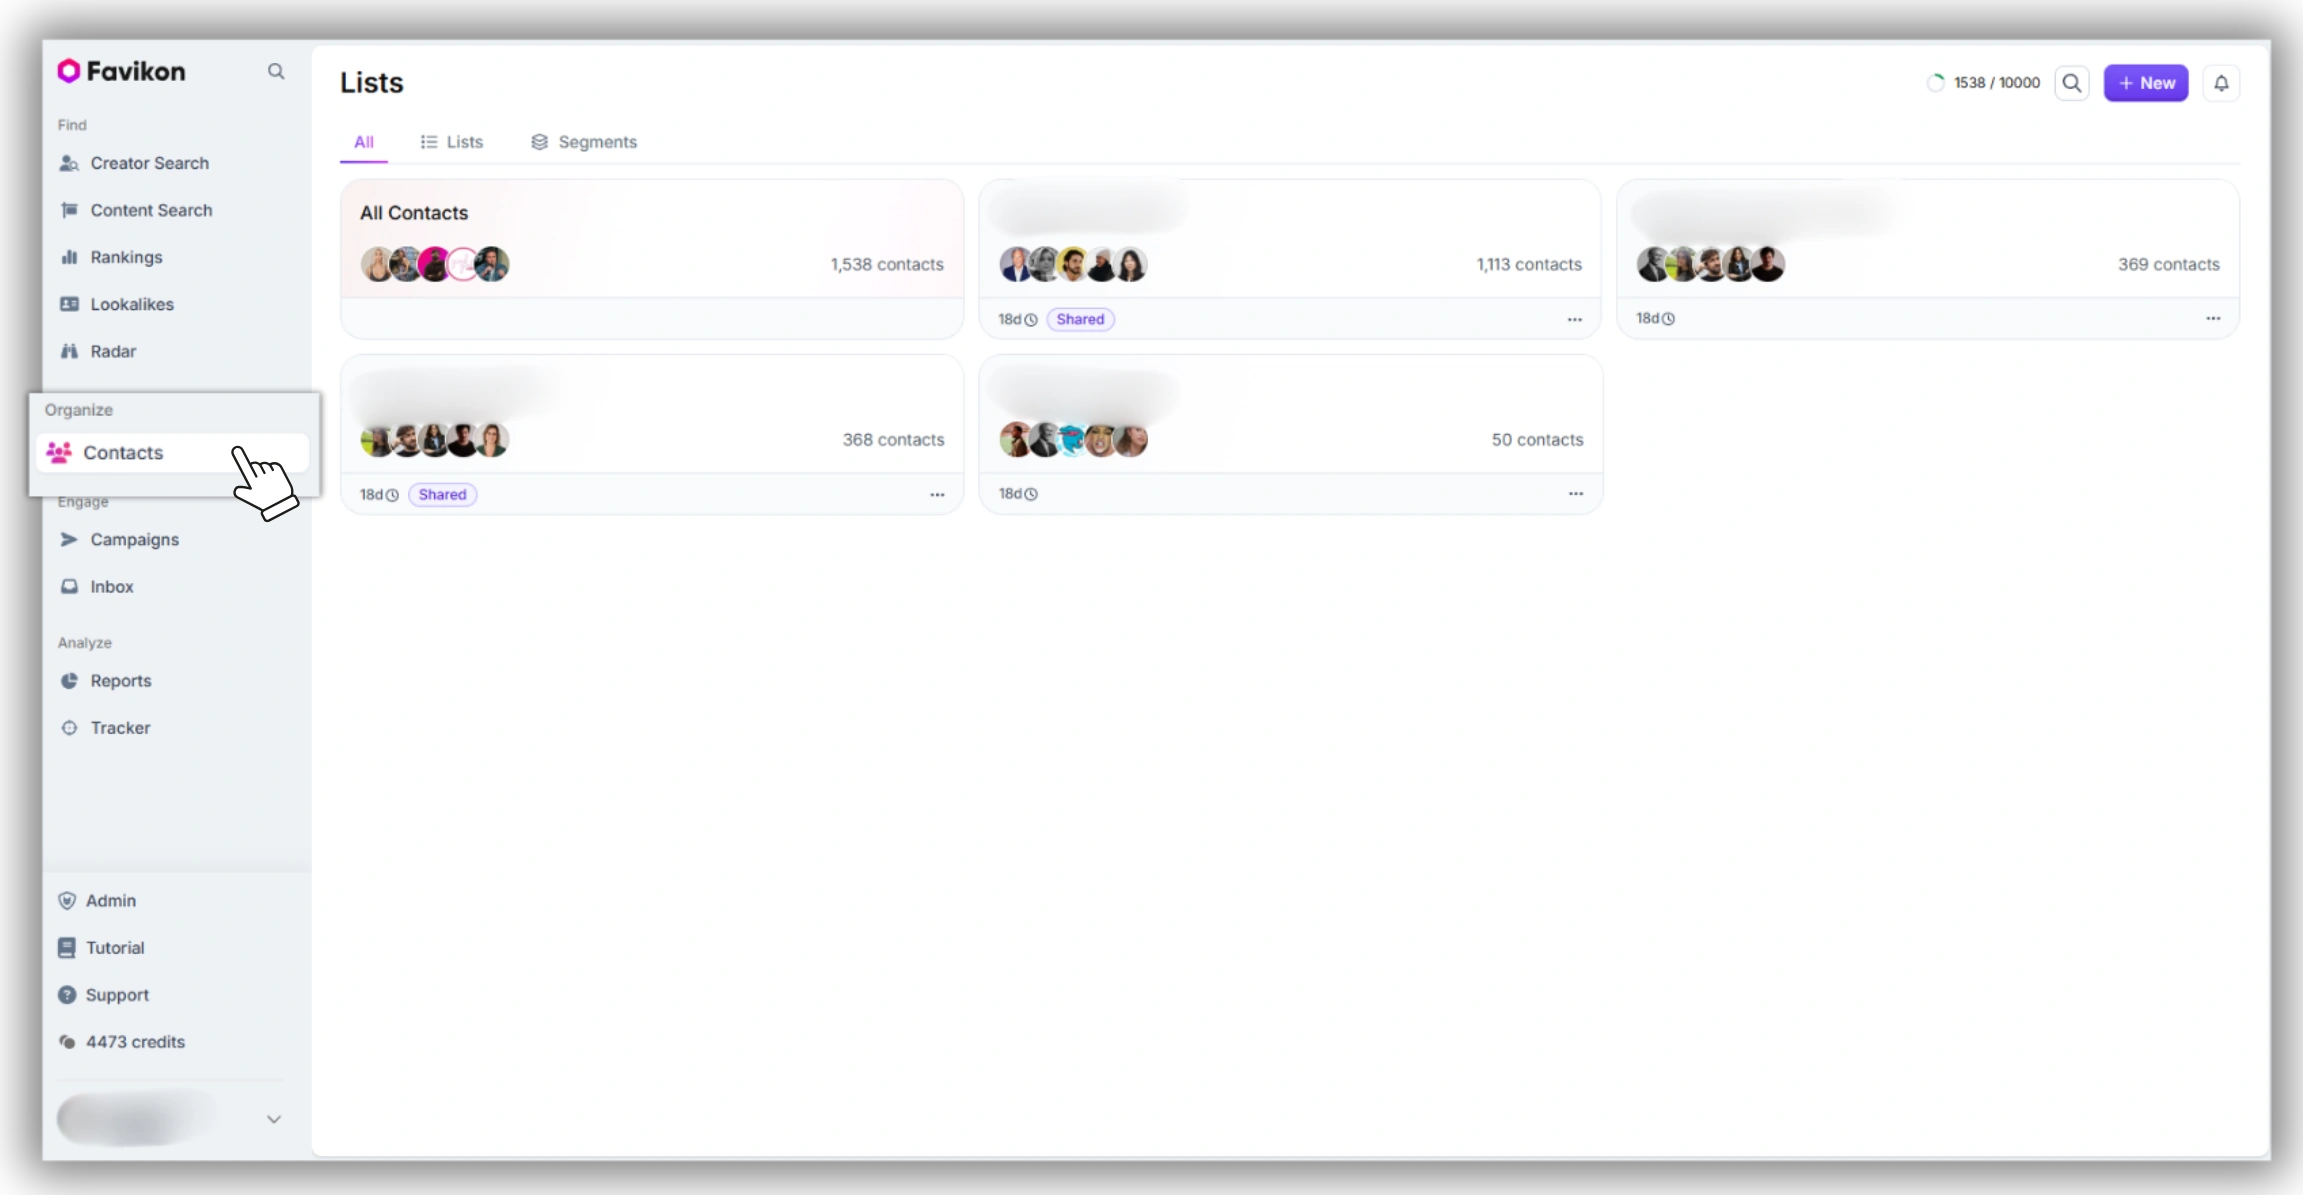
1. In Favikon, navigate to Contact in the left sidebar.
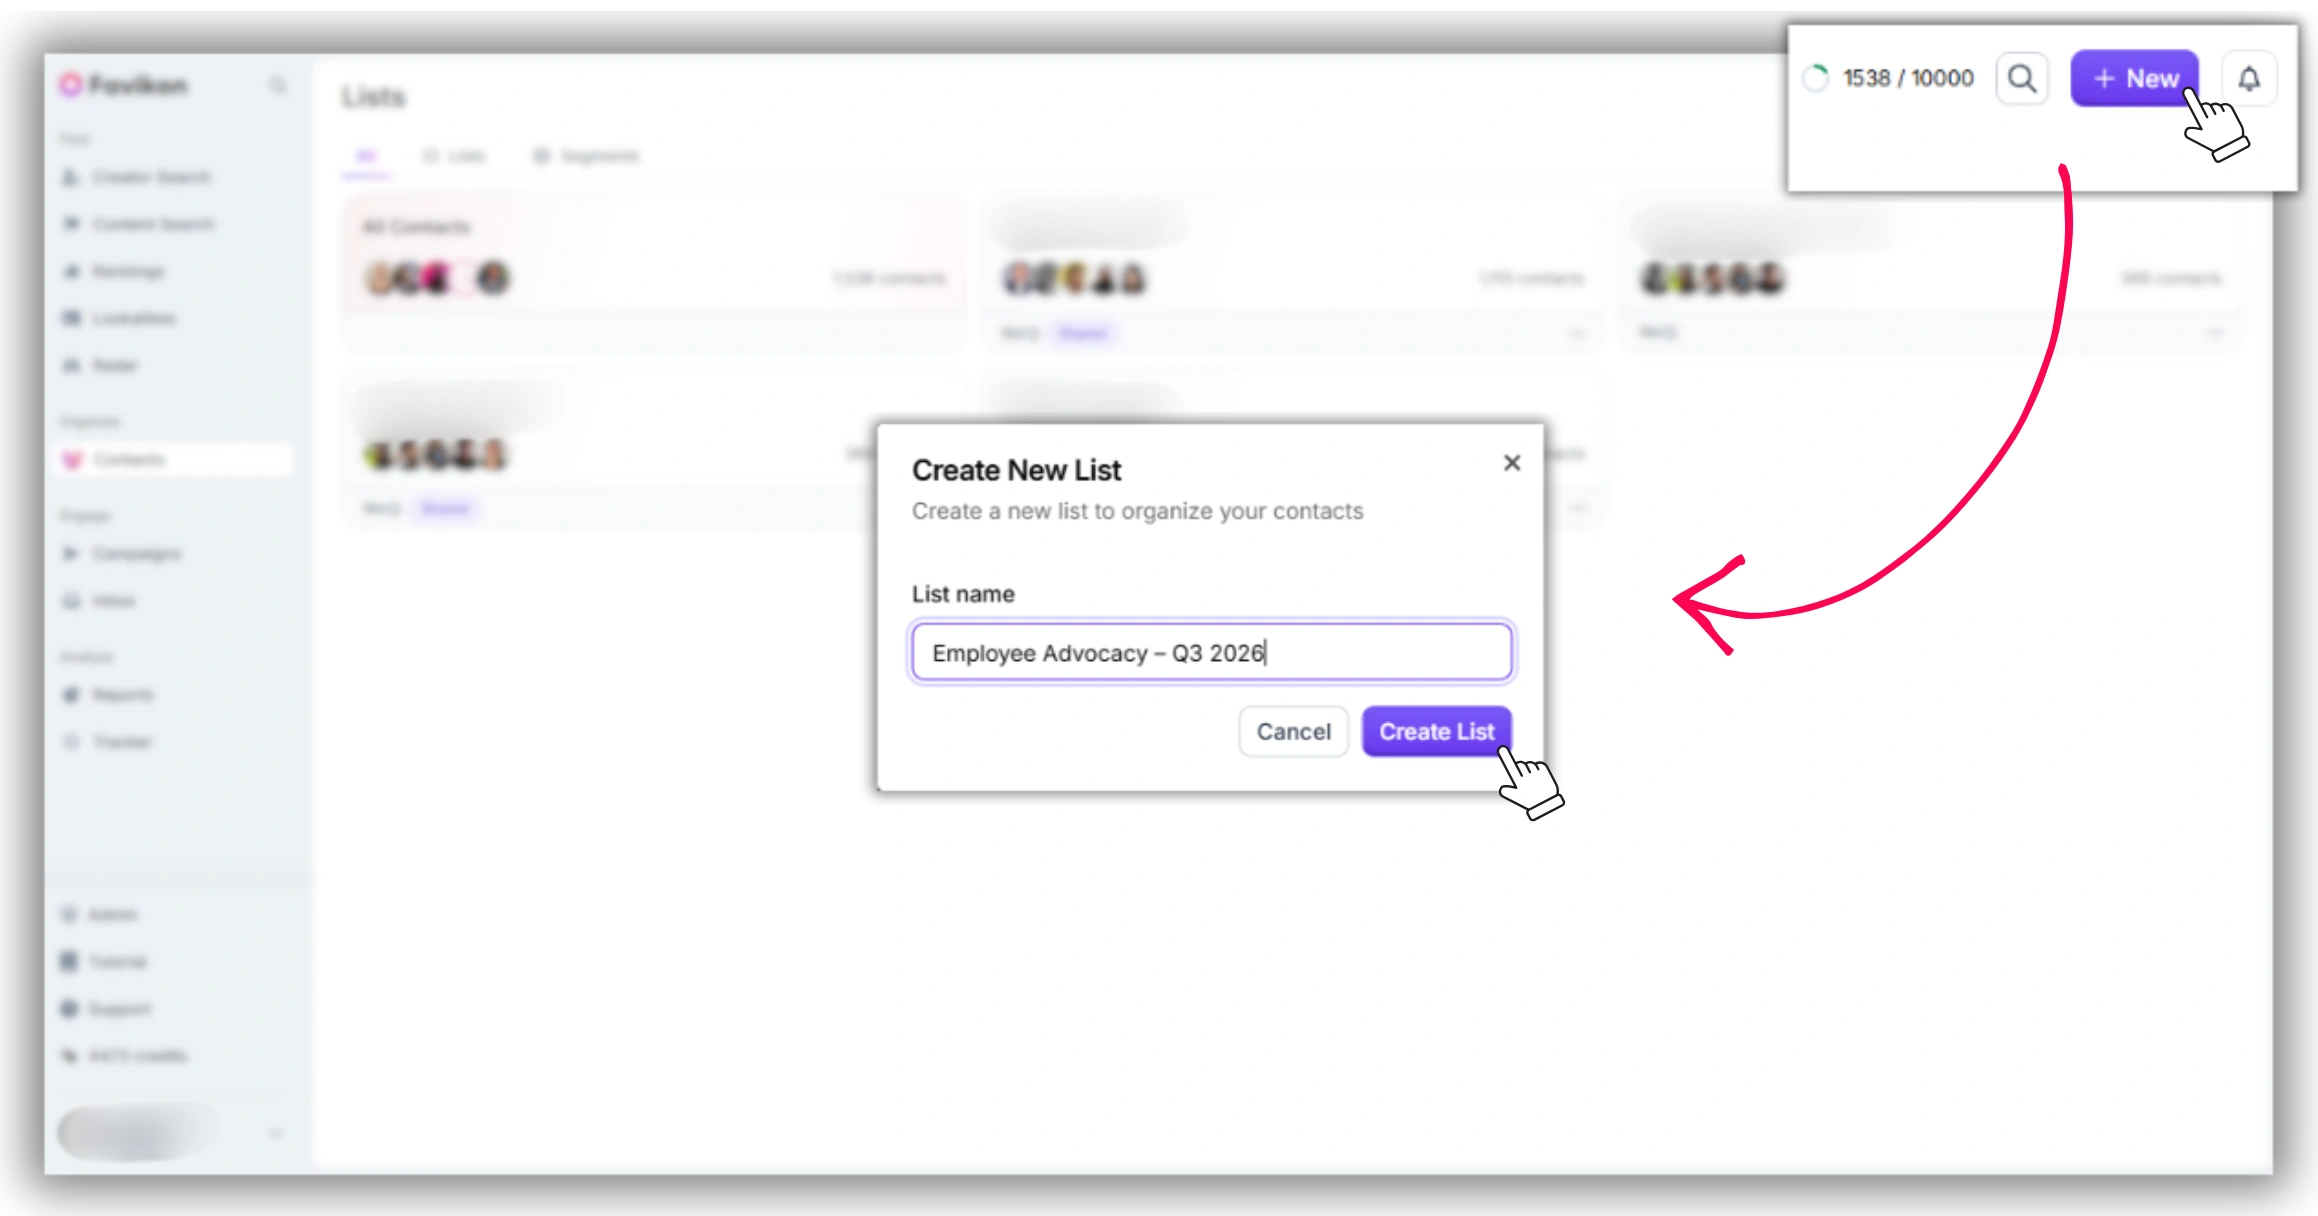
2. Click New, then click List and name it clearly — e.g. “Employee Advocacy – Q3 2026” or “Team LinkedIn – [Company Name].” Use a date-stamped name if you plan to archive snapshots each quarter.
3. Add employees one by one using the Add creator search. Search by their LinkedIn name or handle. If the employee has a LinkedIn presence indexed by Favikon (any account with more than ~100 followers), they’ll appear in the results.
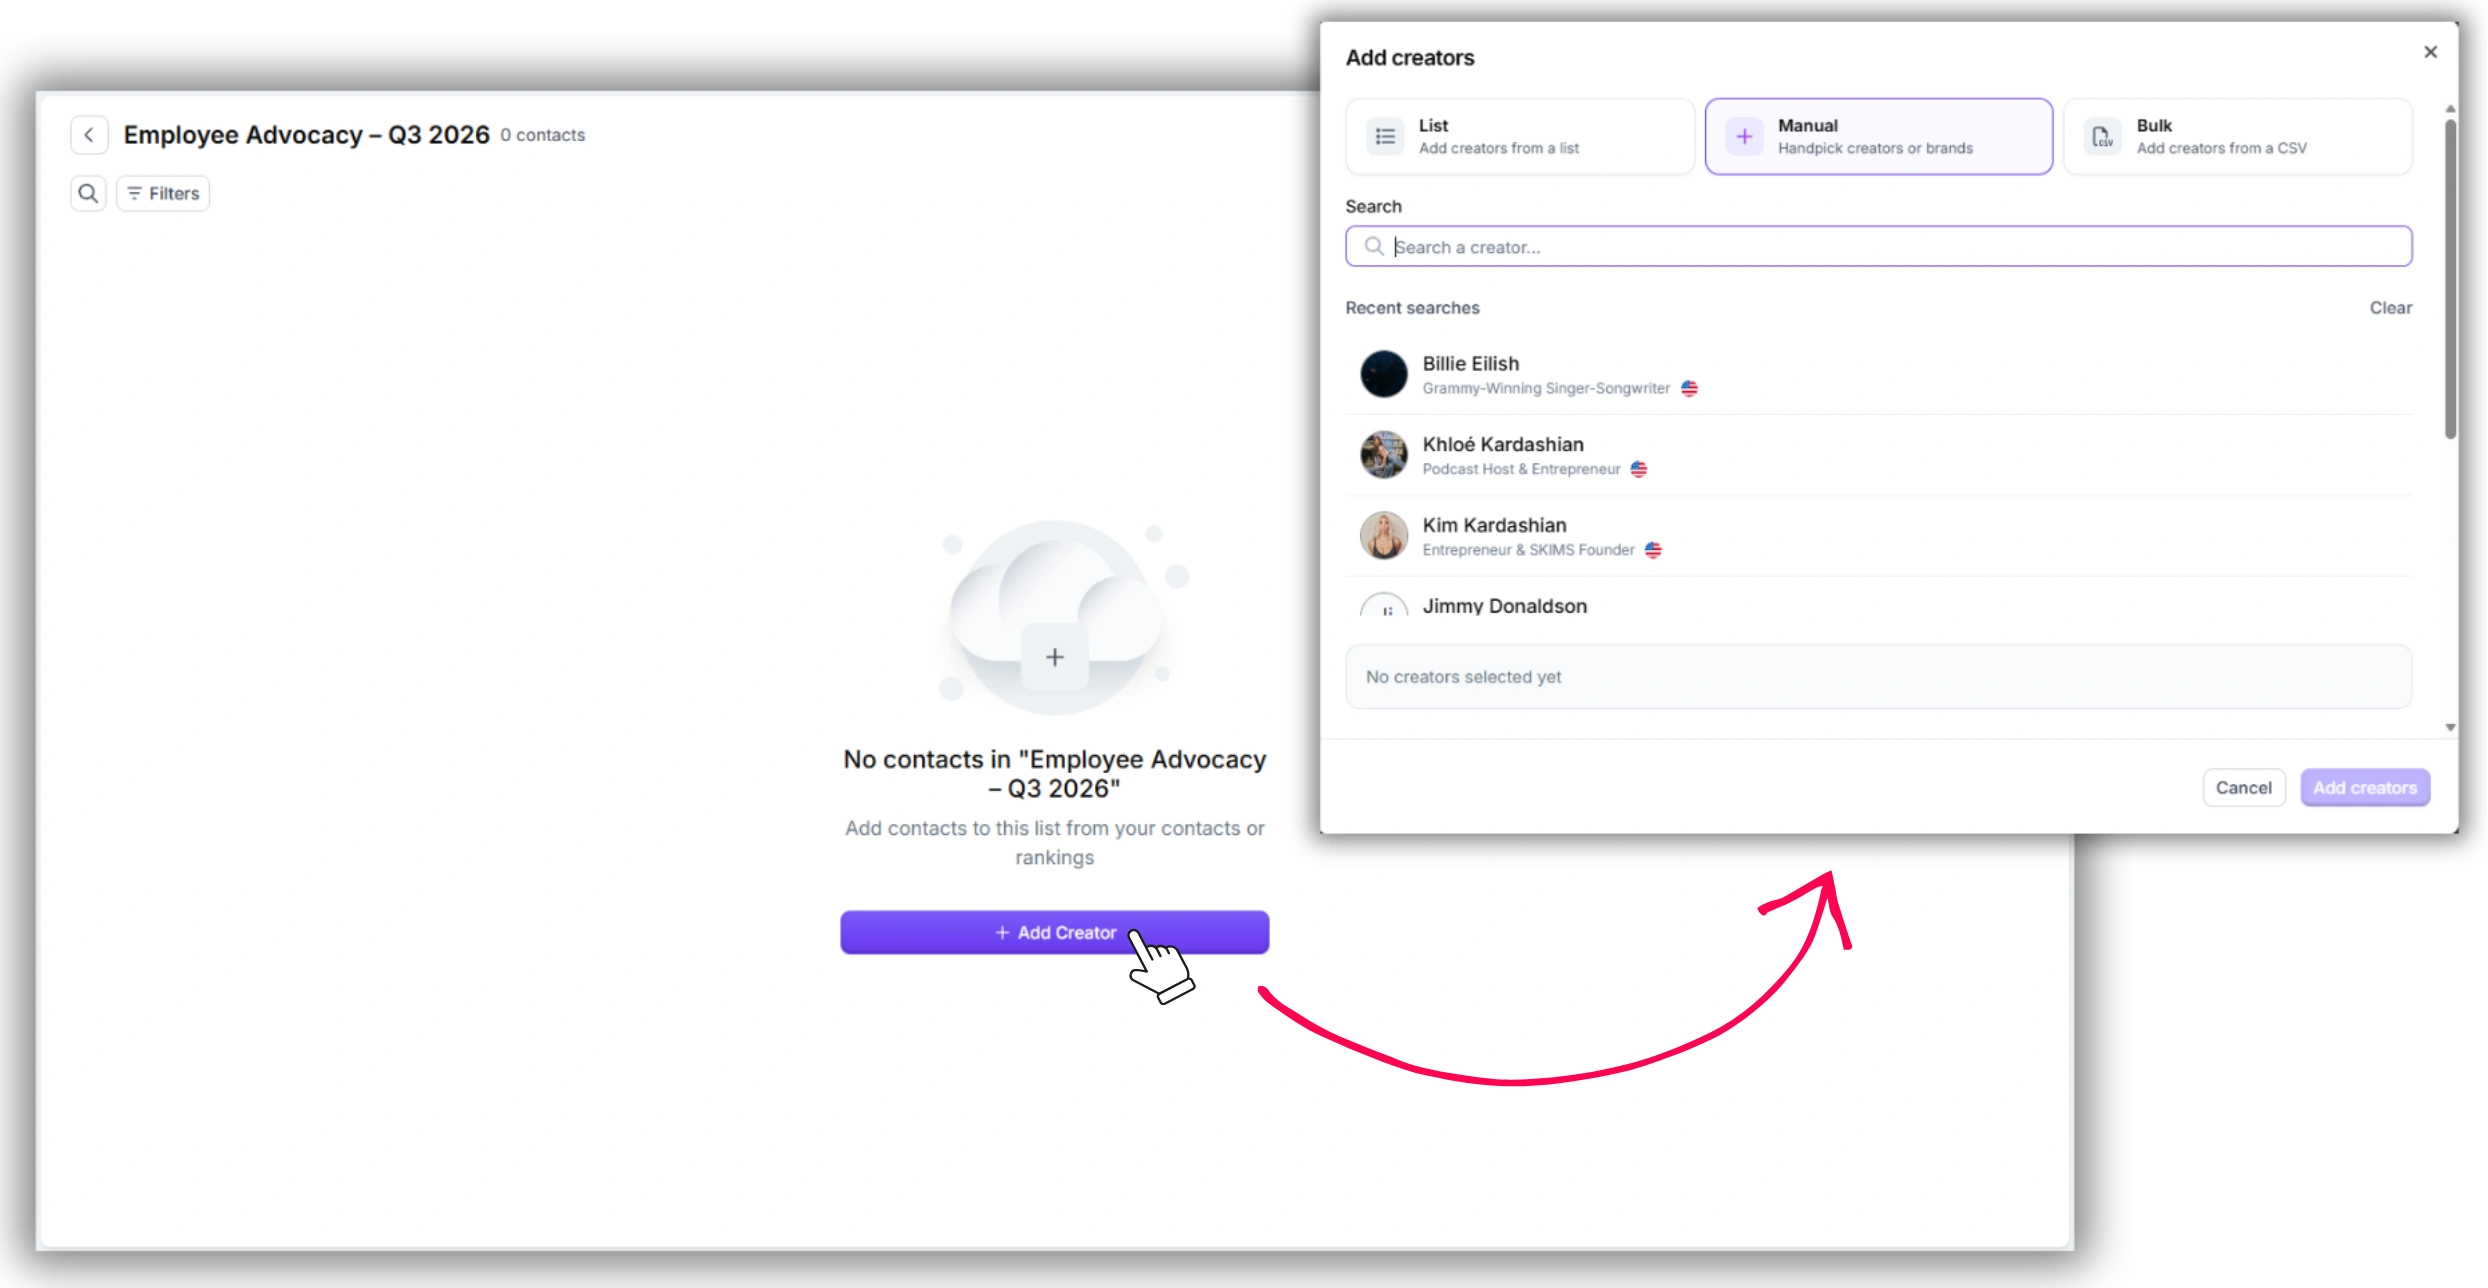
4. Repeat for every employee you want to track. There’s no minimum or maximum for the list — most advocacy tracking lists run between 5 and 50 creators.
Do employees need to sign up to Favikon? No. Favikon tracks publicly available LinkedIn data — posts, follower counts, engagement. Employees don’t need accounts or opt-in. The data source is the public LinkedIn profile.
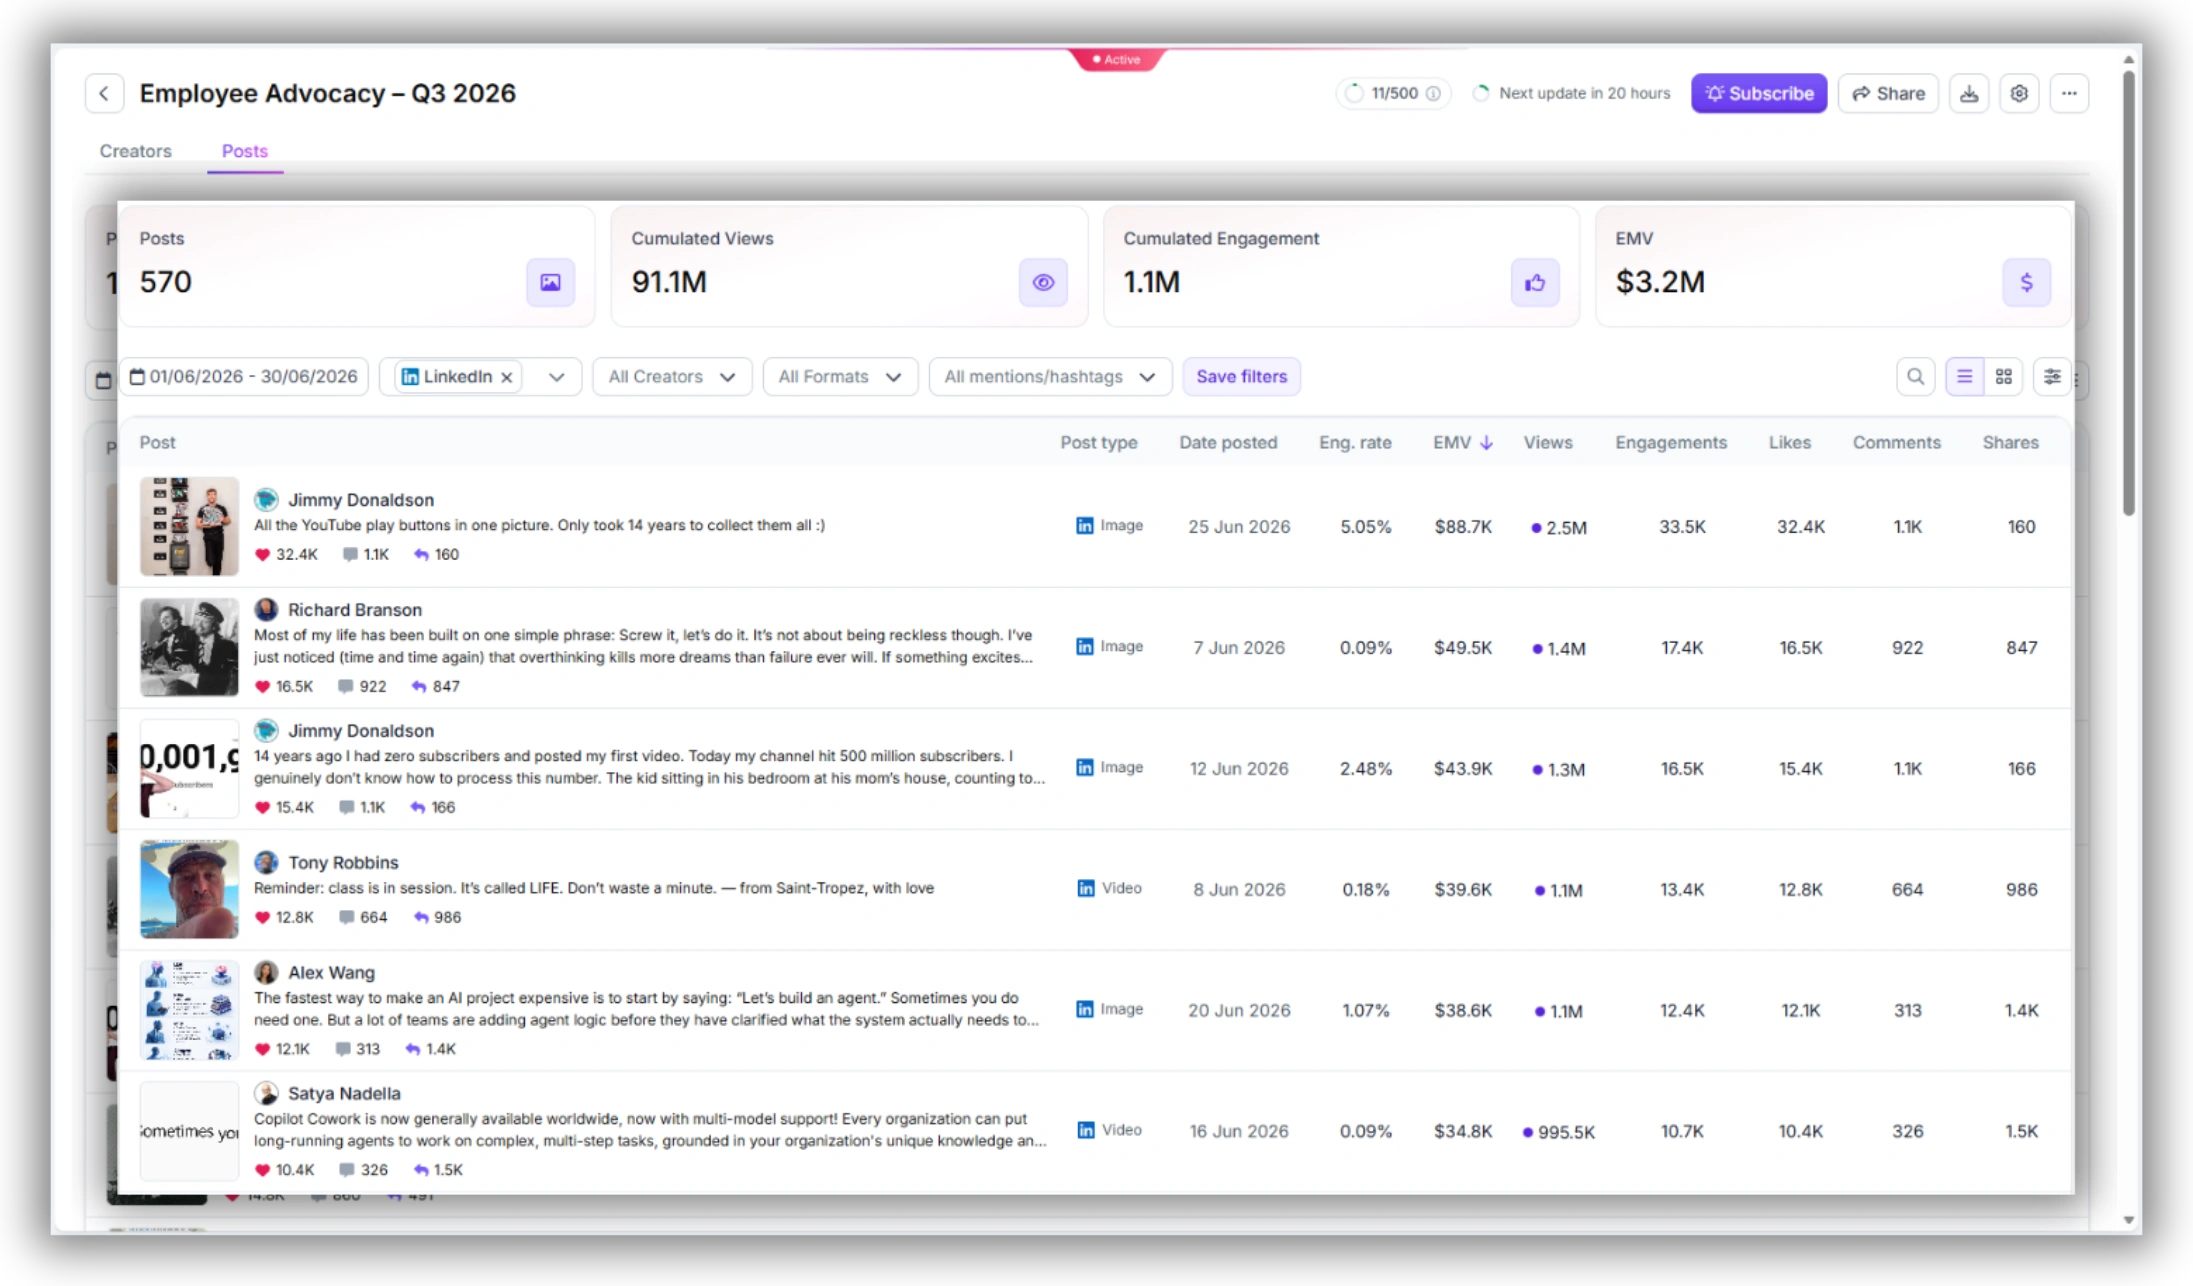
Step 2: Open Tracker and switch to the By Creator view
1. From the left sidebar, navigate to Tracker.
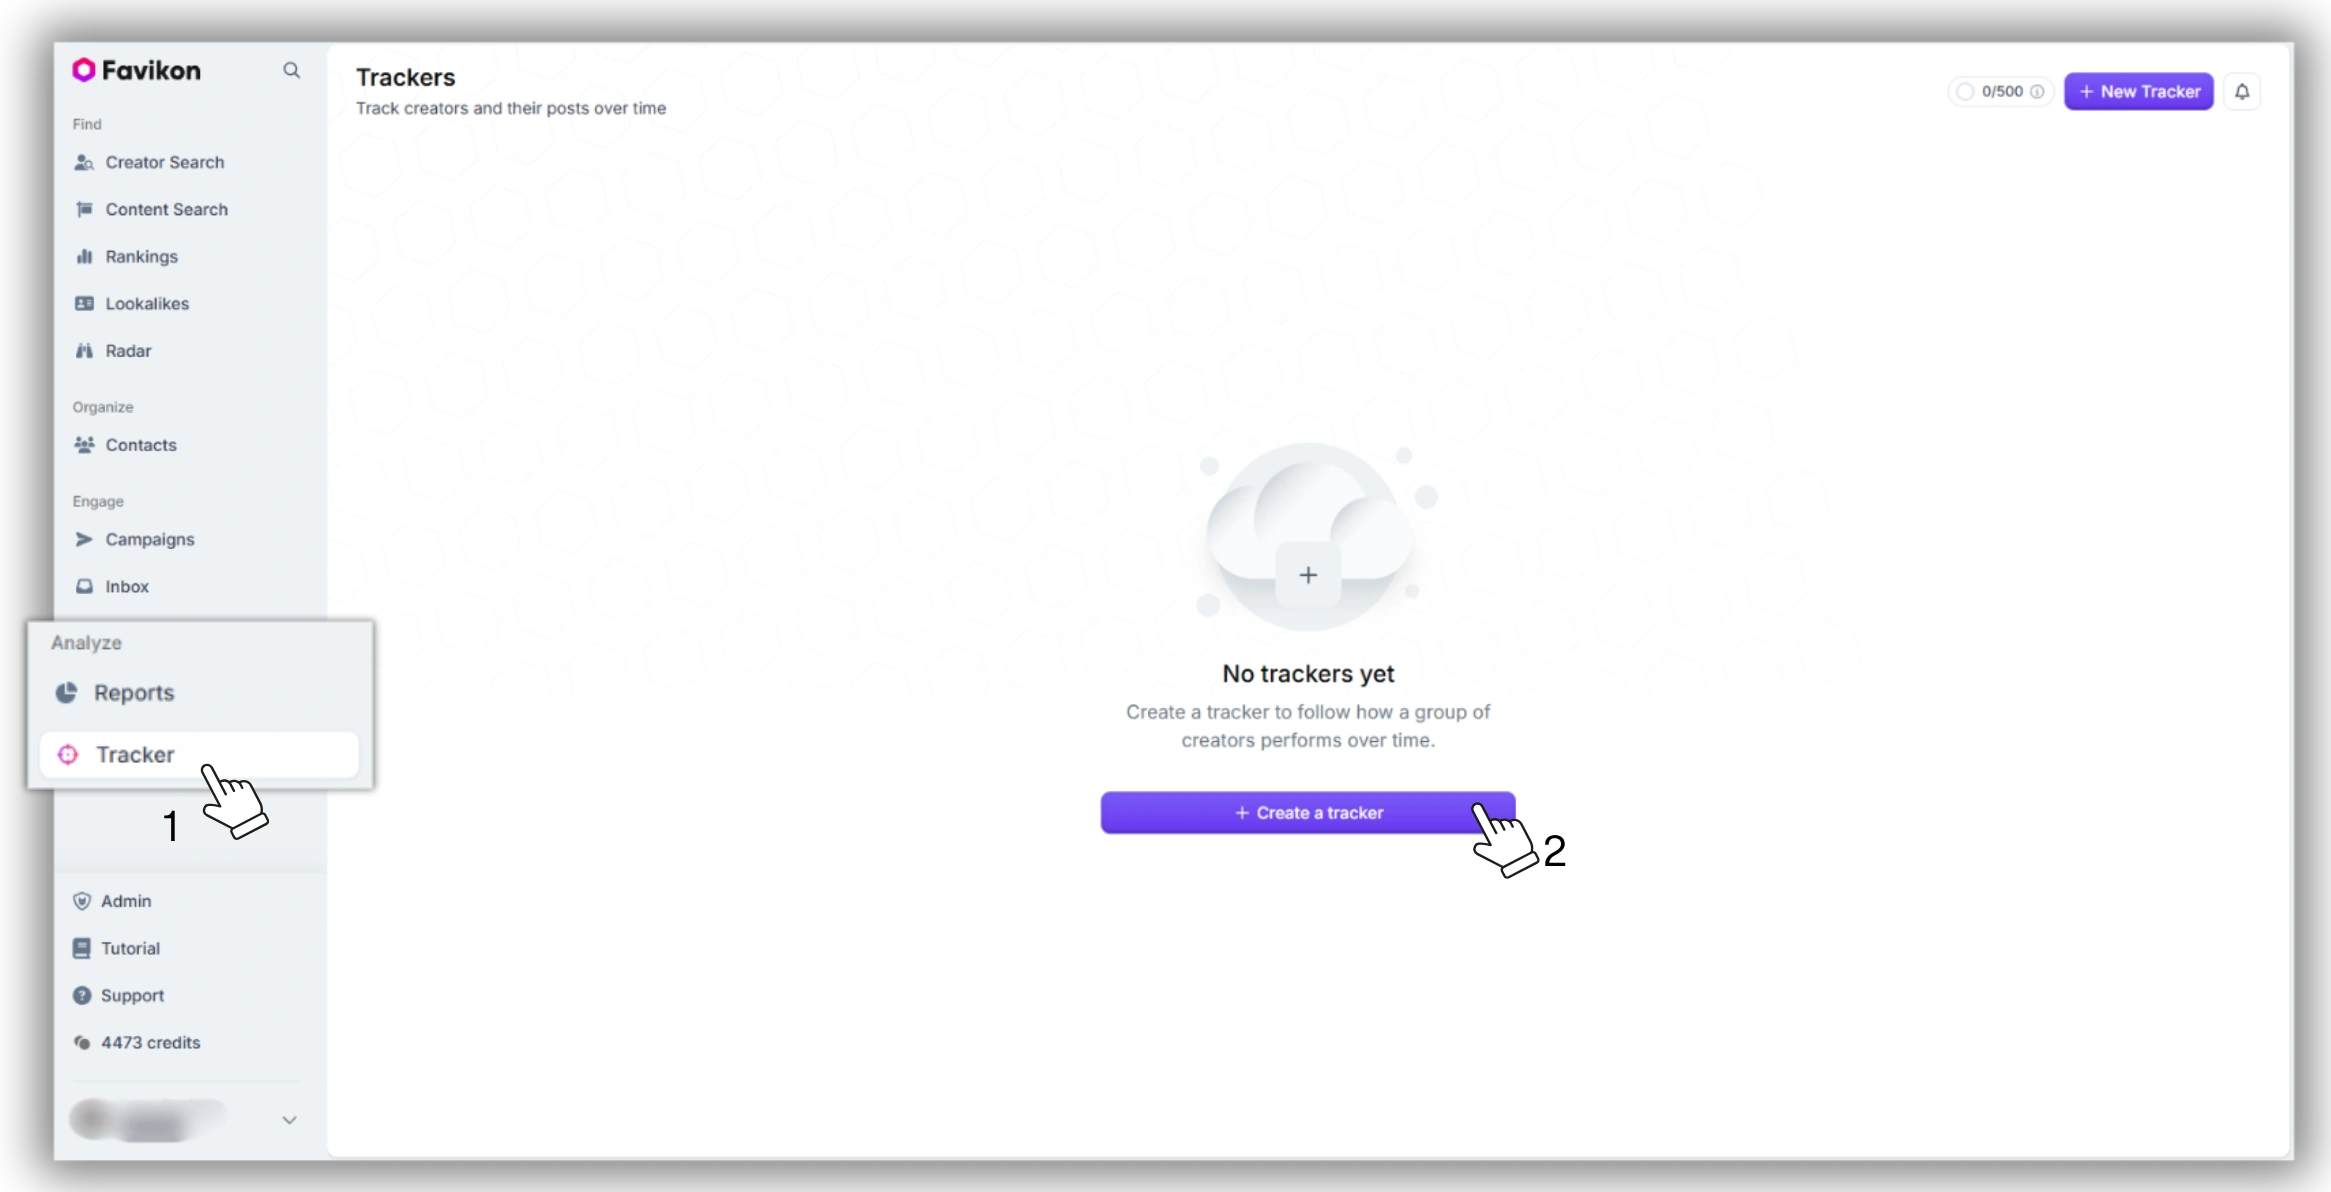
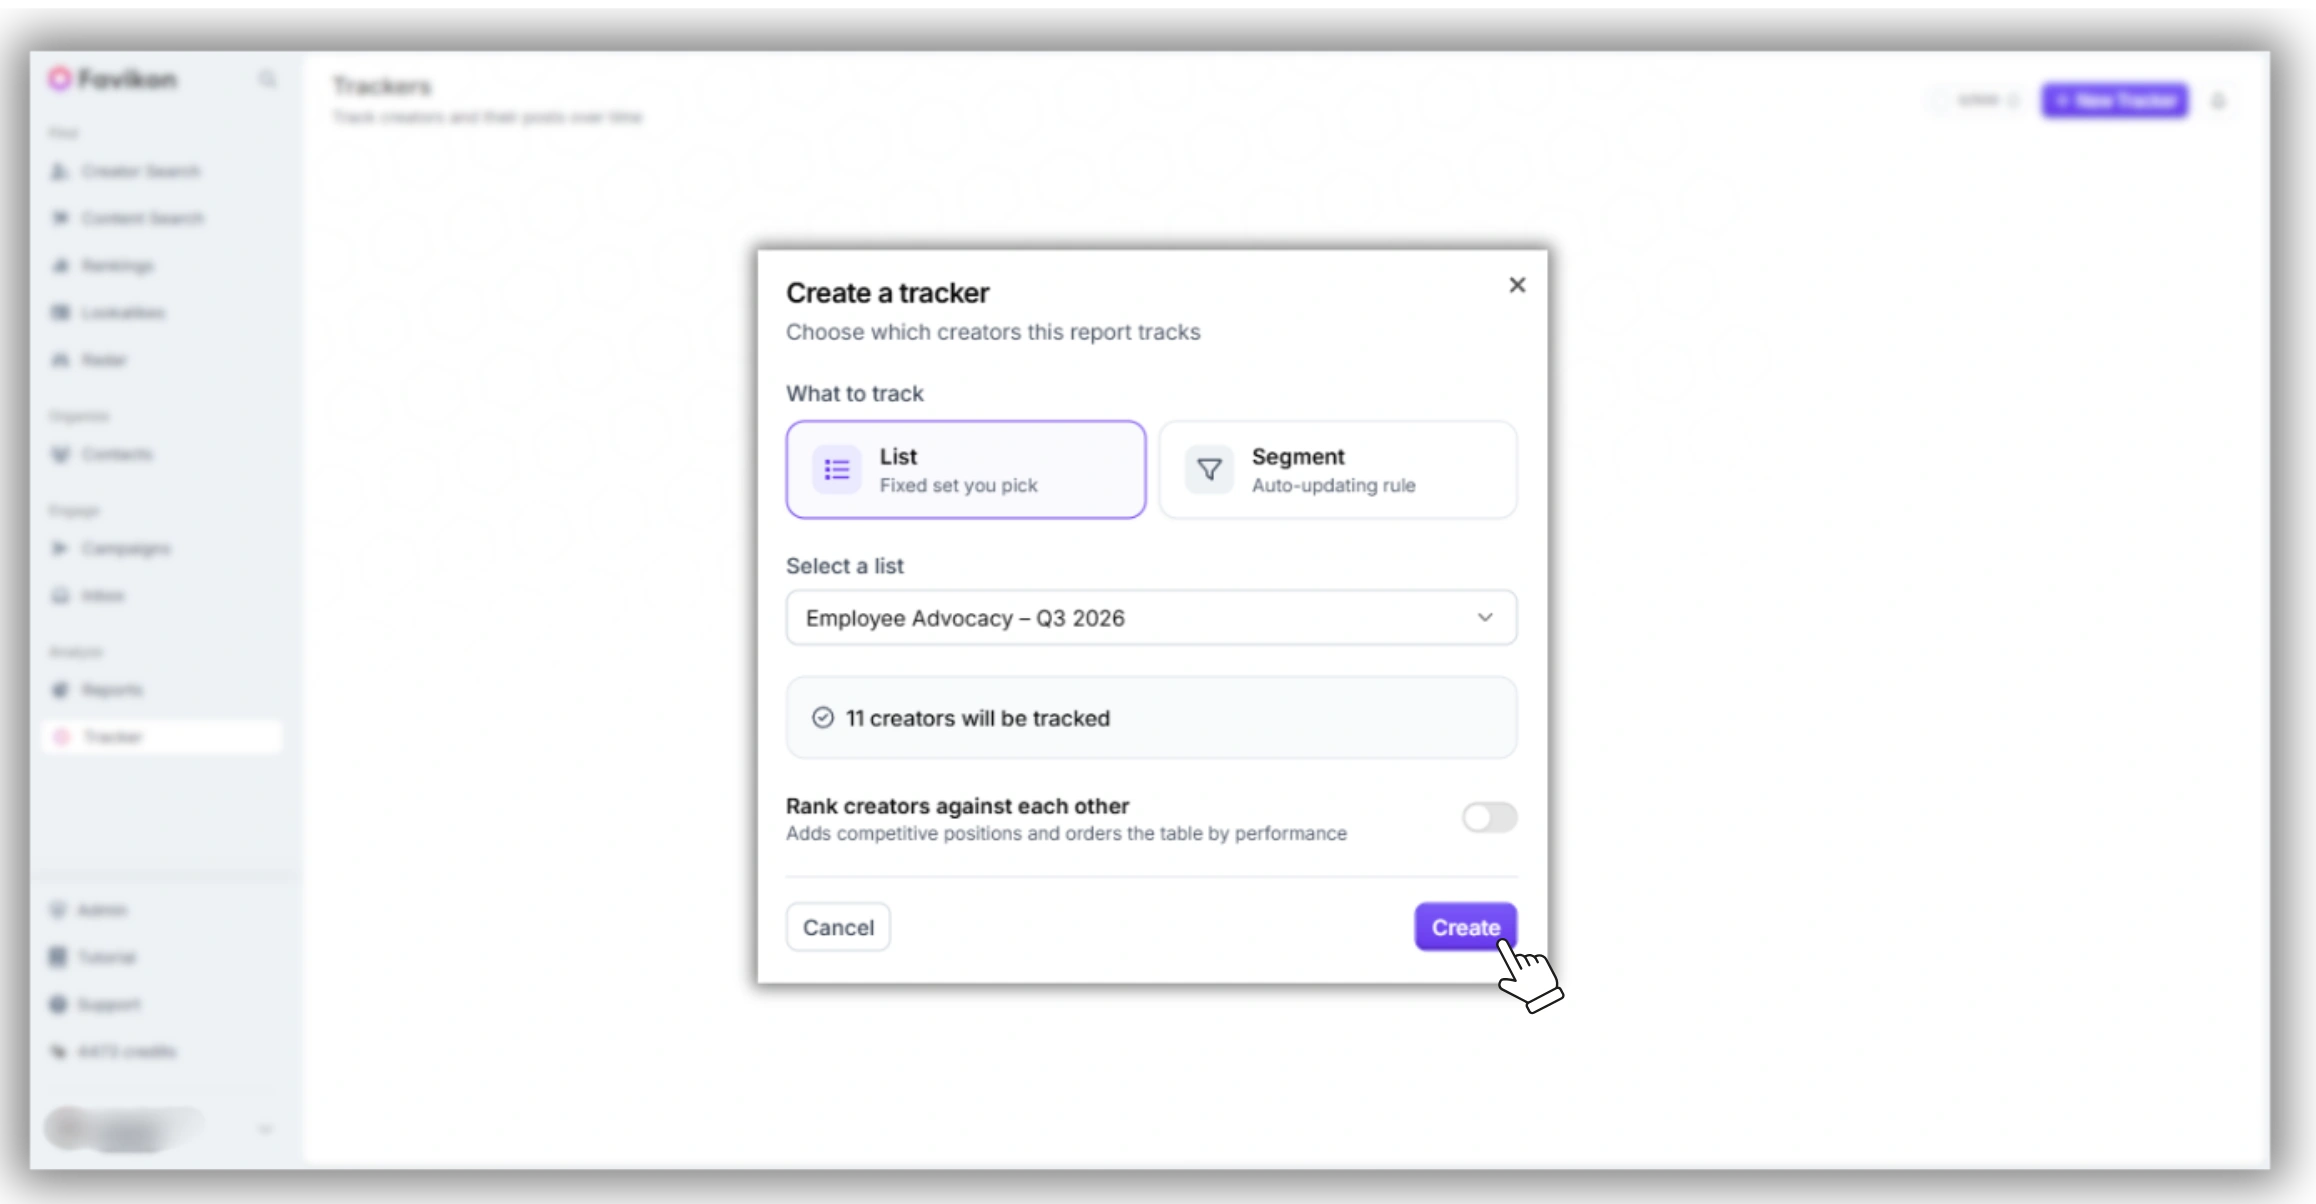
2. Select your employee List from the dropdown at the top of the Tracker interface. The default view shows all tracked creators.
3. Switch from the default By Post view to By Creator using the toggle at the top right of the Tracker panel. The By Creator view aggregates each employee’s performance into a single row per person.
4. Filter by platform: select LinkedIn from the platform filter. This removes any Instagram, X, or YouTube data from the view and surfaces only LinkedIn performance.
Step 3: Set the tracking window
1. Use the date range picker in the Tracker to set your reporting window. For a monthly report, set it to the past 30 days. For a quarterly snapshot, set to the past 90 days.
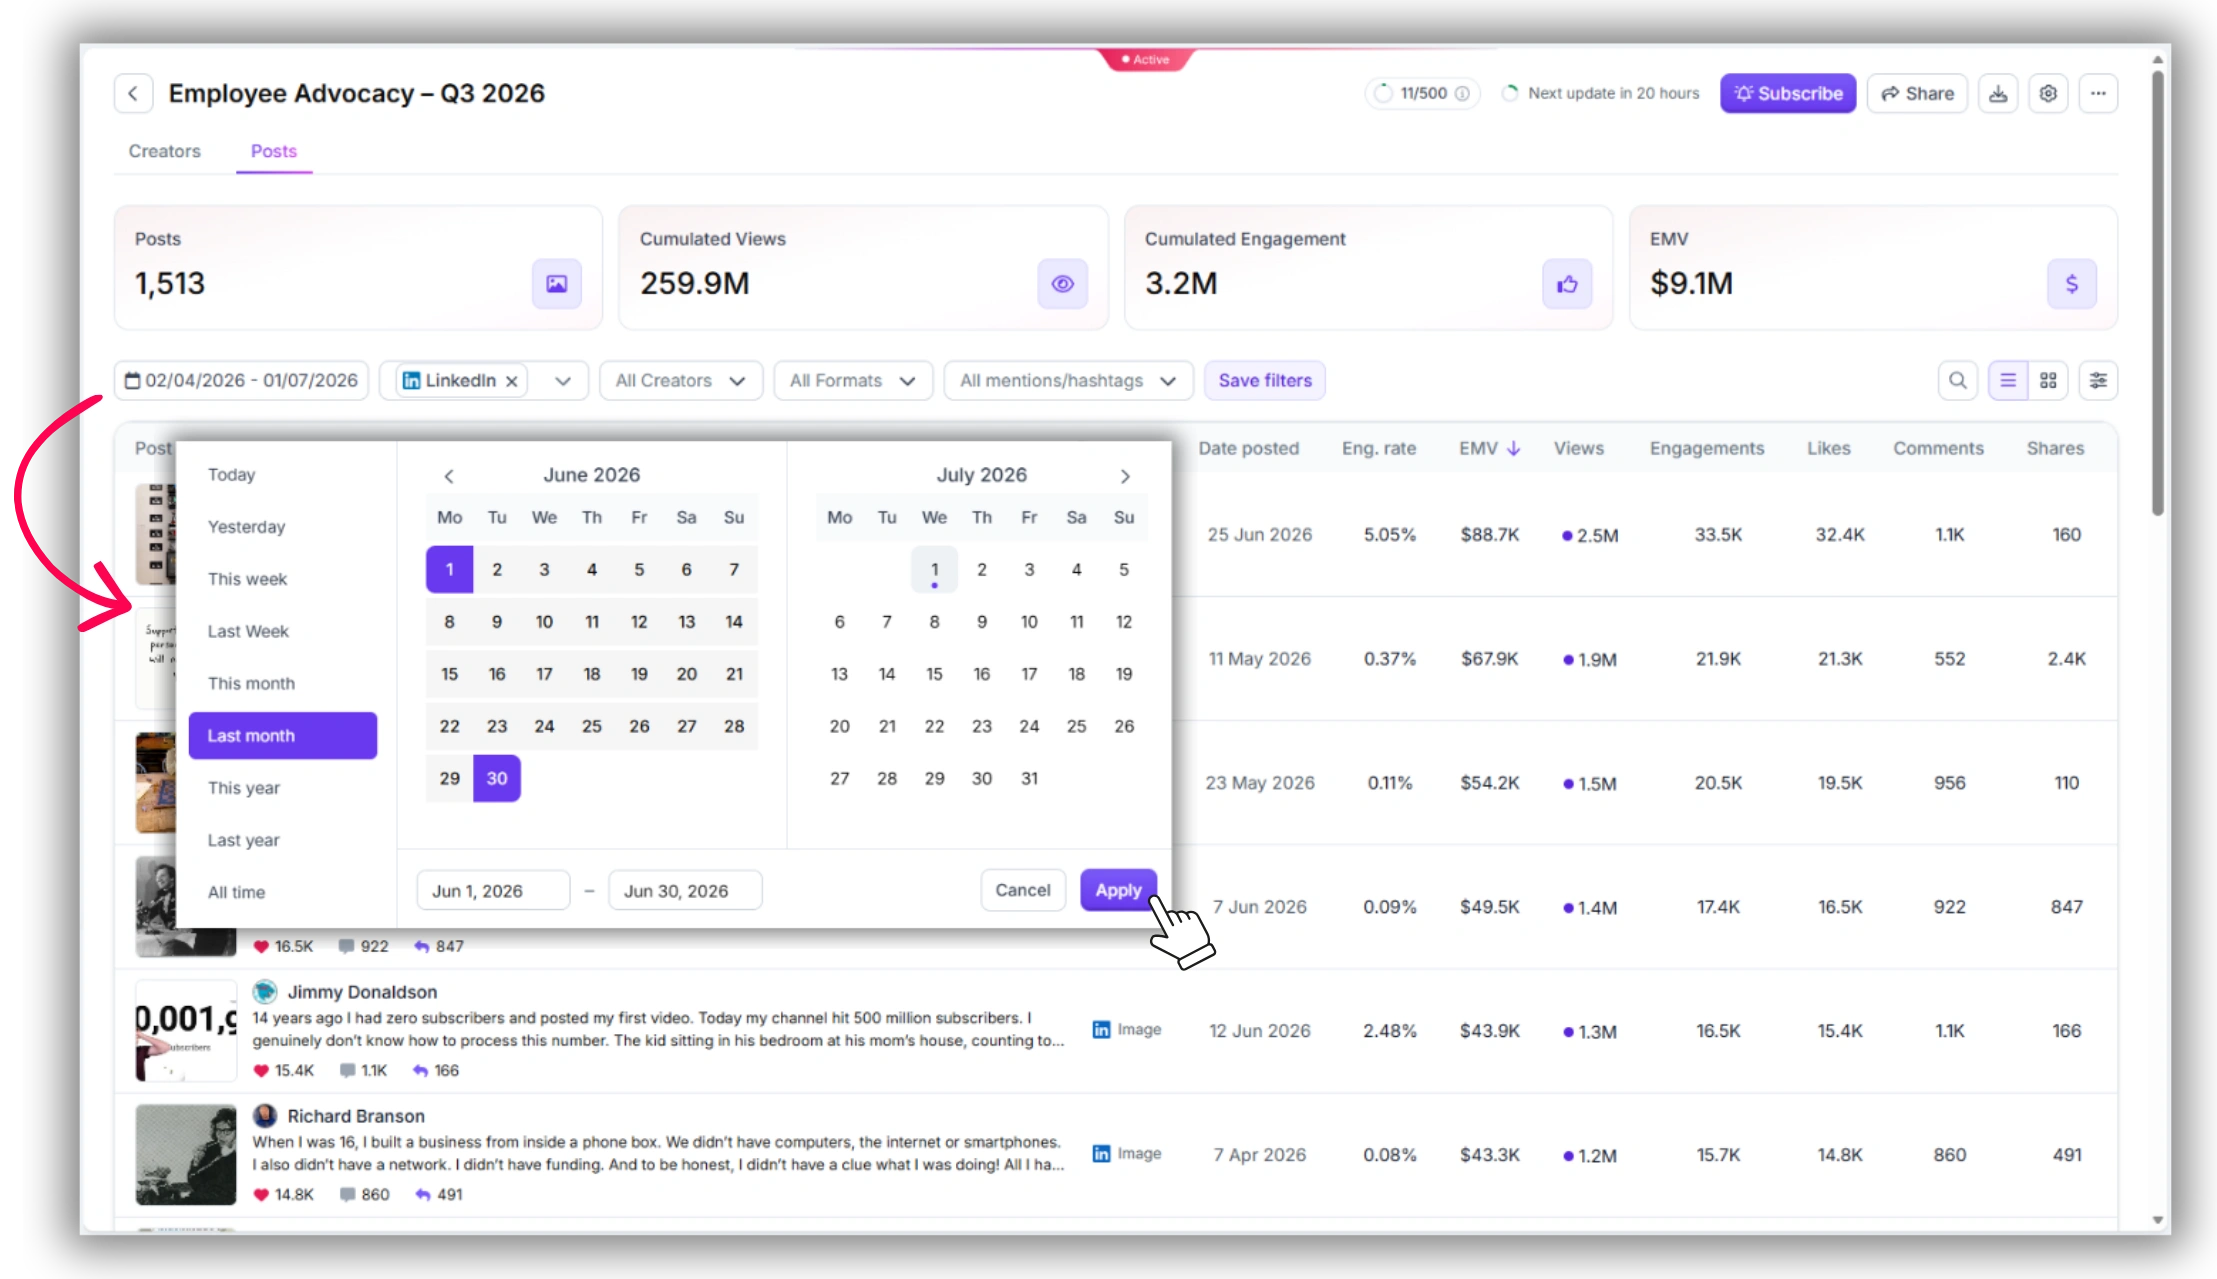
2. For ongoing monitoring, set Tracker alerts to notify you when any creator in the list posts new content. This gives you a real-time feed of employee LinkedIn activity without manually checking each profile.
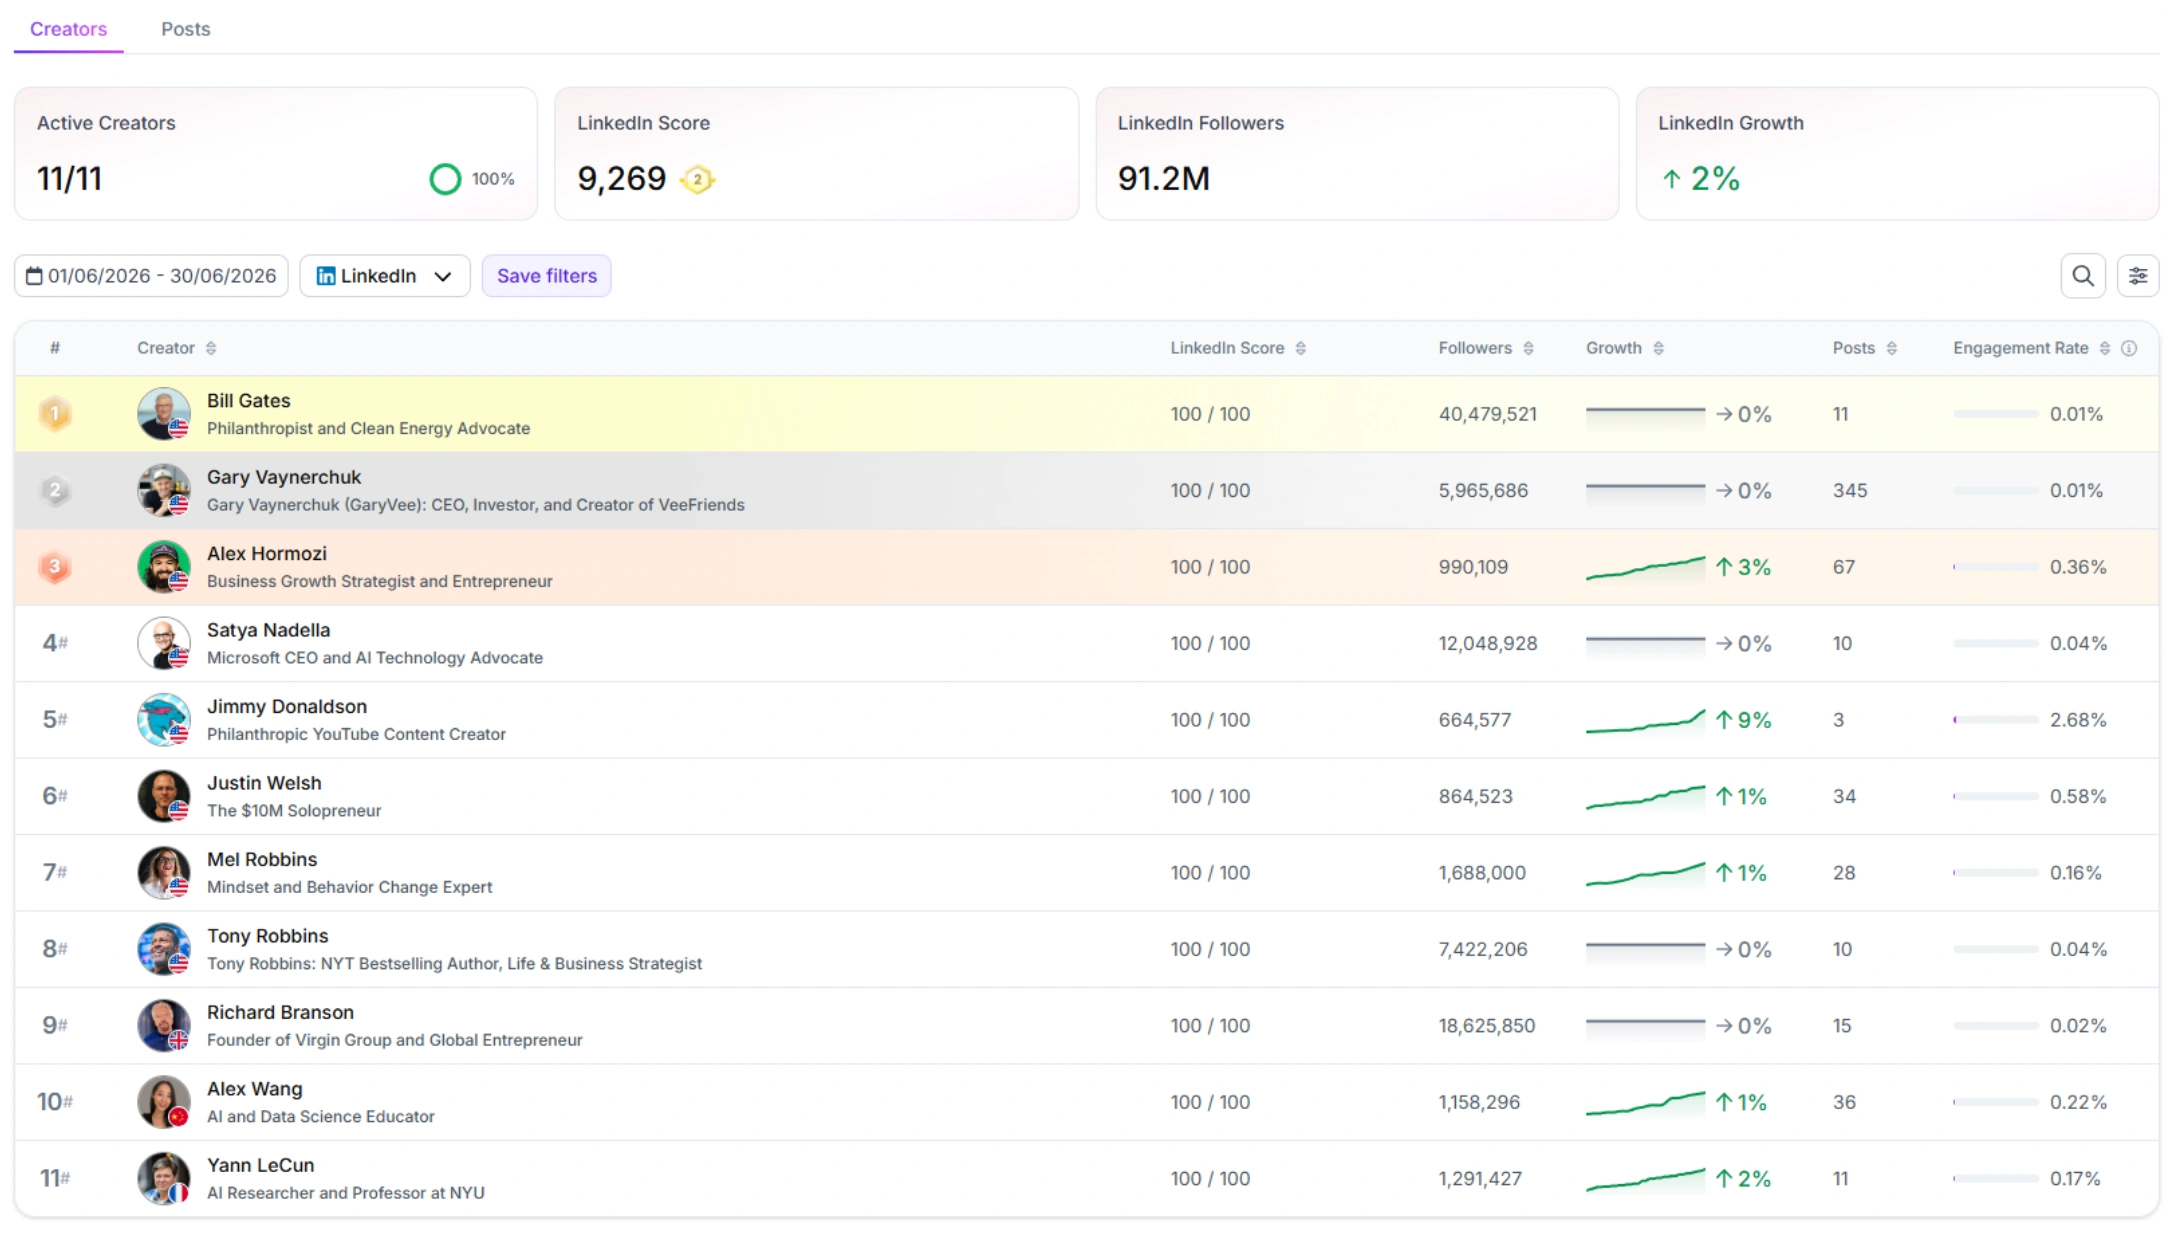
4. How to Read the By Creator View: Spotting Your Top Employee Influencers
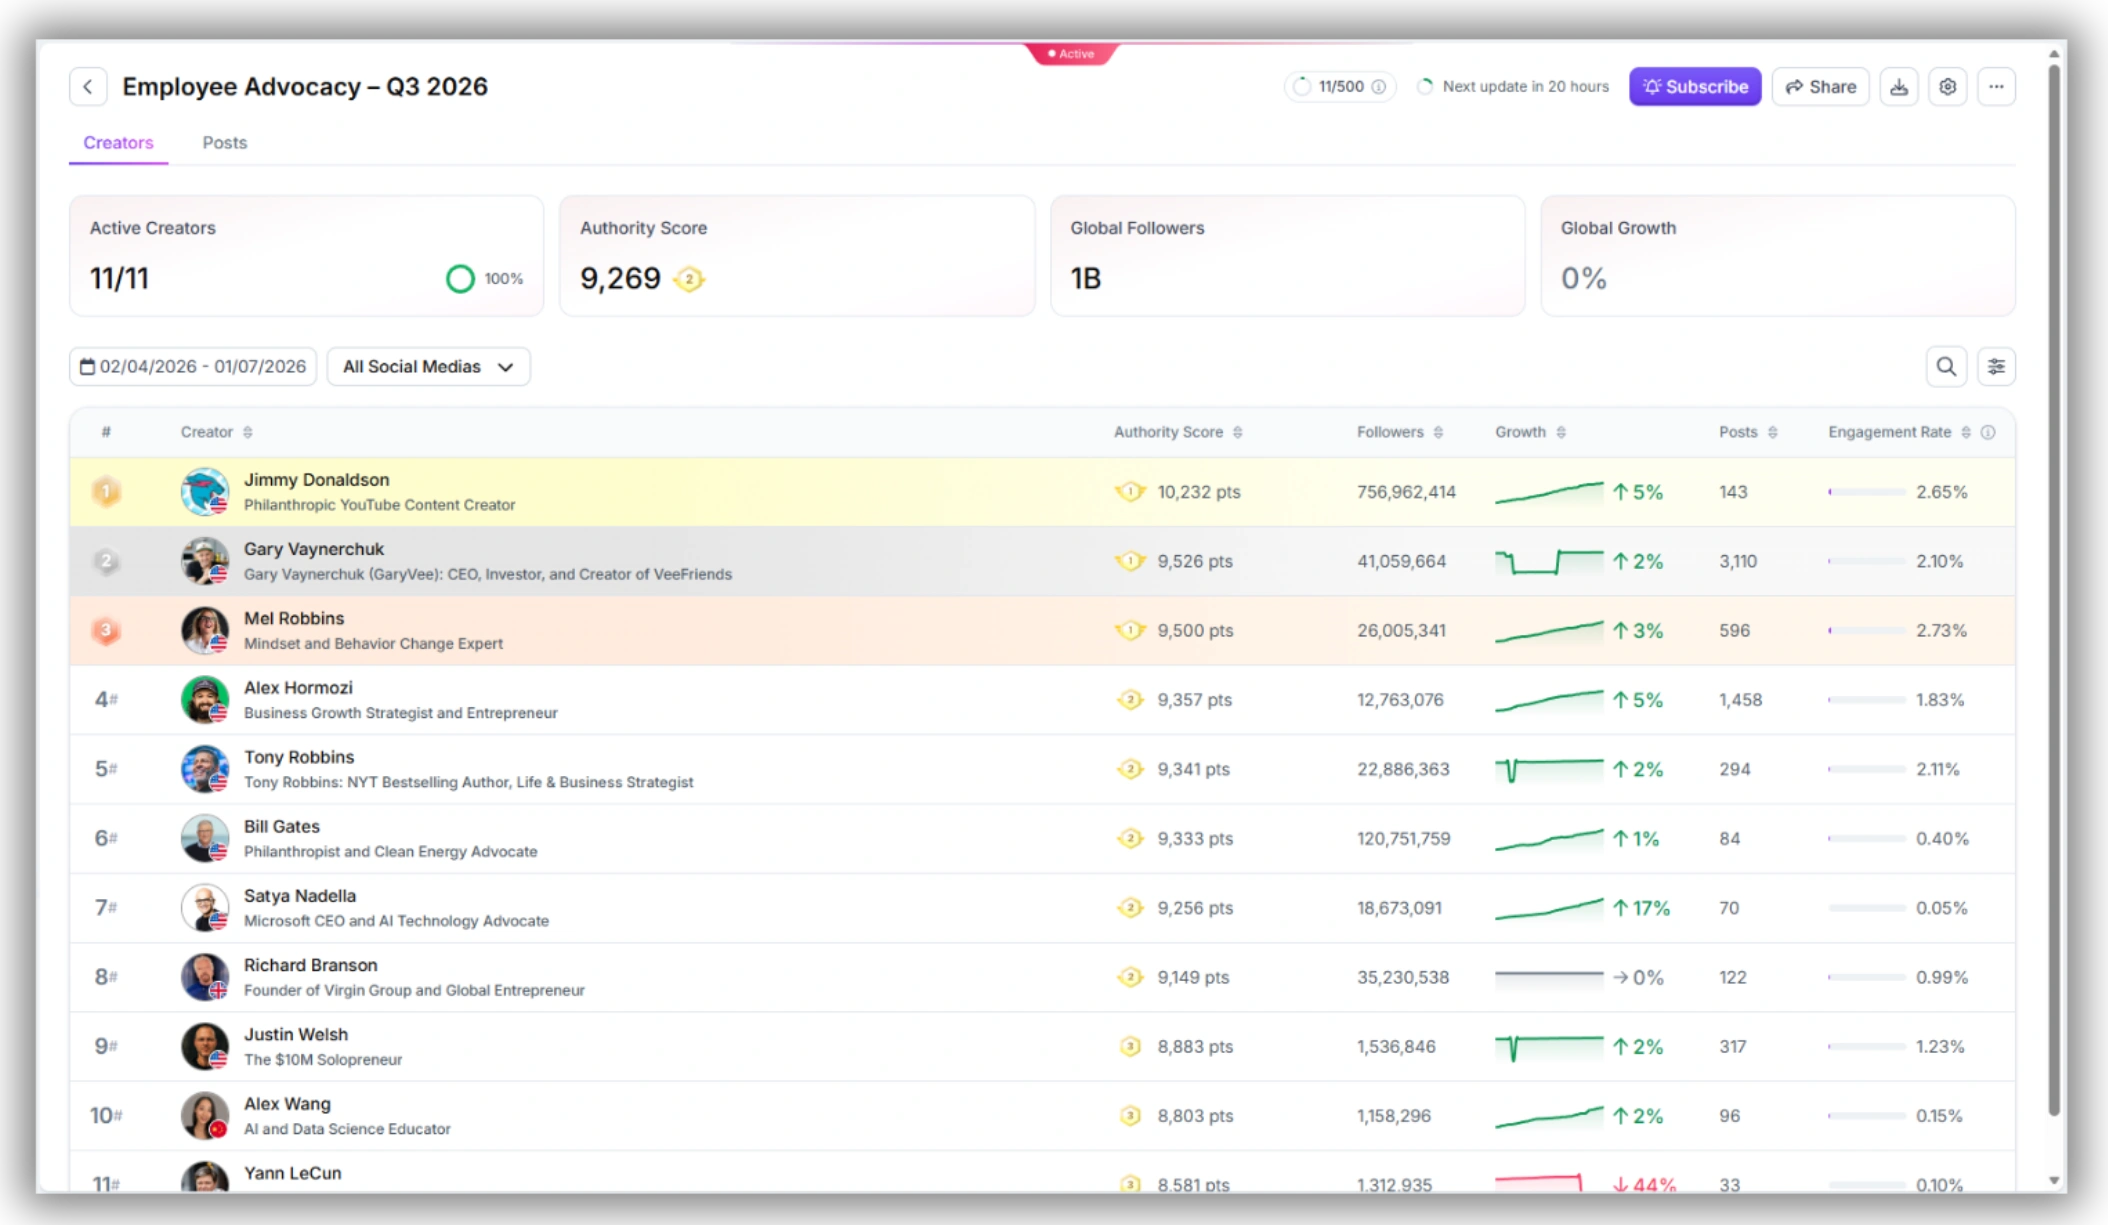
Once the By Creator view is populated, you have a ranked table of employee LinkedIn performance. Here’s how to read it.
Sort by Authority Score first
Authority Score is the composite ranking metric. It combines posting frequency, engagement quality, follower growth, and content consistency into a single 0–100 score. Sorting by Authority Score descending gives you your ranked employee influencer list immediately — the employees at the top are the ones with the most developed LinkedIn presence in their professional niche.
Authority Score above 60: strong LinkedIn creator. This employee has an established niche presence and above-average engagement quality. They’re your primary advocacy assets.
Authority Score 40–60: developing presence. Consistent posting but either a smaller audience or moderate engagement quality. These employees benefit most from content coaching and posting support.
Authority Score below 40: early-stage or inactive. Either a new LinkedIn presence or an employee who posts infrequently. Don’t ignore them — this group has the highest growth potential if activated.
The “top 3 employee influencer” read
For leadership reporting, identify the top 3 employees by Authority Score in your tracking window. These three carry a disproportionate share of the program’s total reach and engagement. Knowing who they are lets you:
• Prioritize their content with internal amplification (company page reshares, colleague engagement)
• Brief them first on product launches, campaign moments, or company news that benefits from personal LinkedIn distribution
• Track their individual growth quarter-over-quarter as a proxy for the program’s compounding value
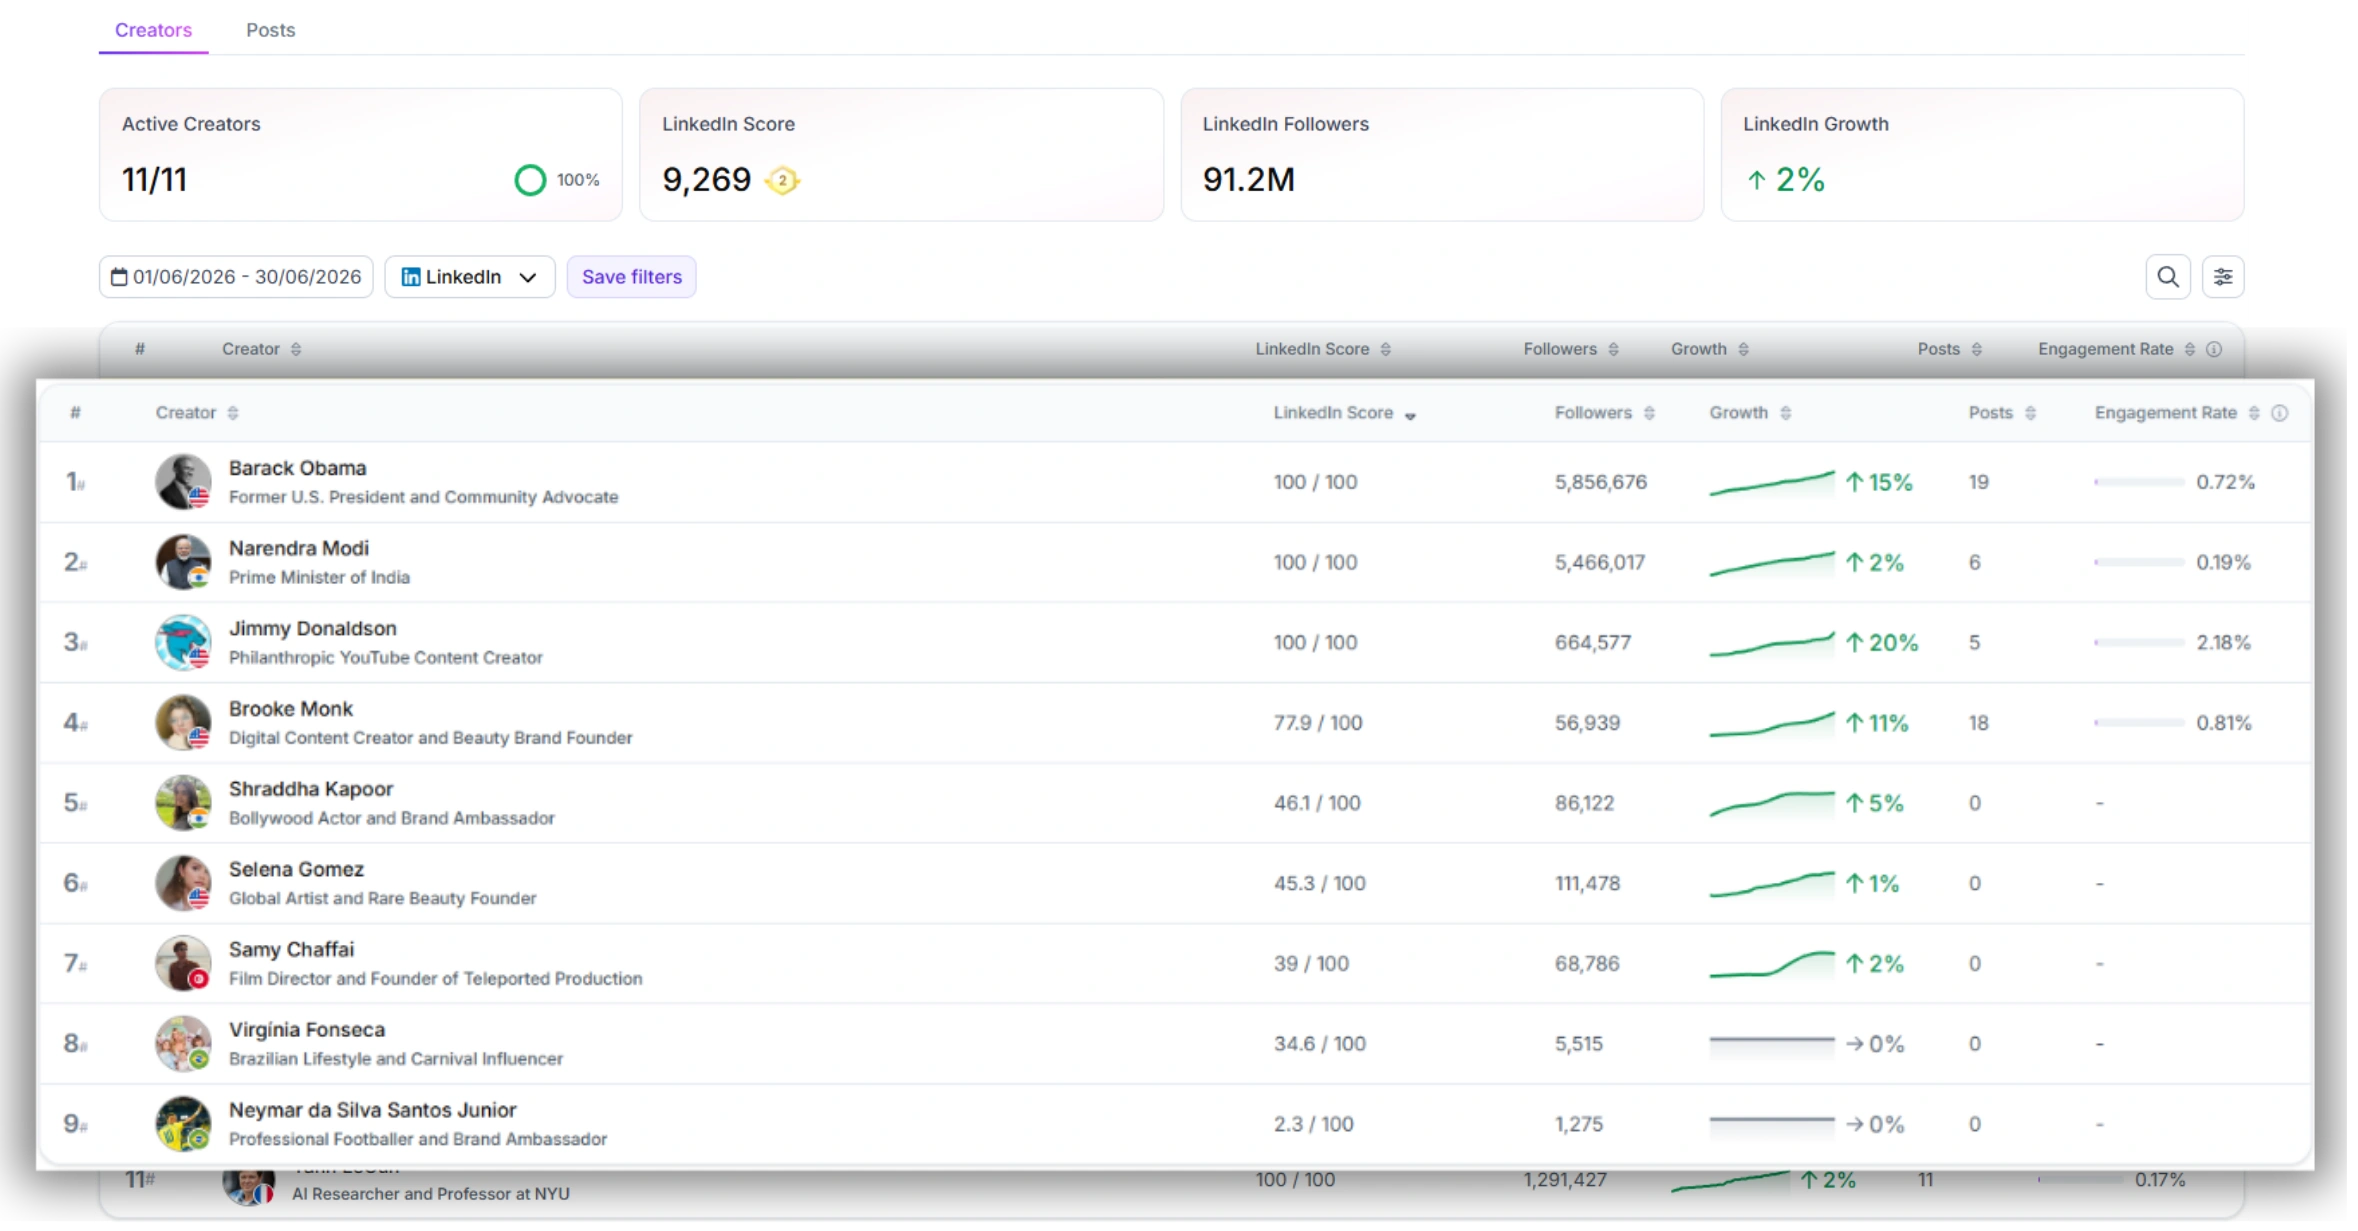
Cross-checks to run
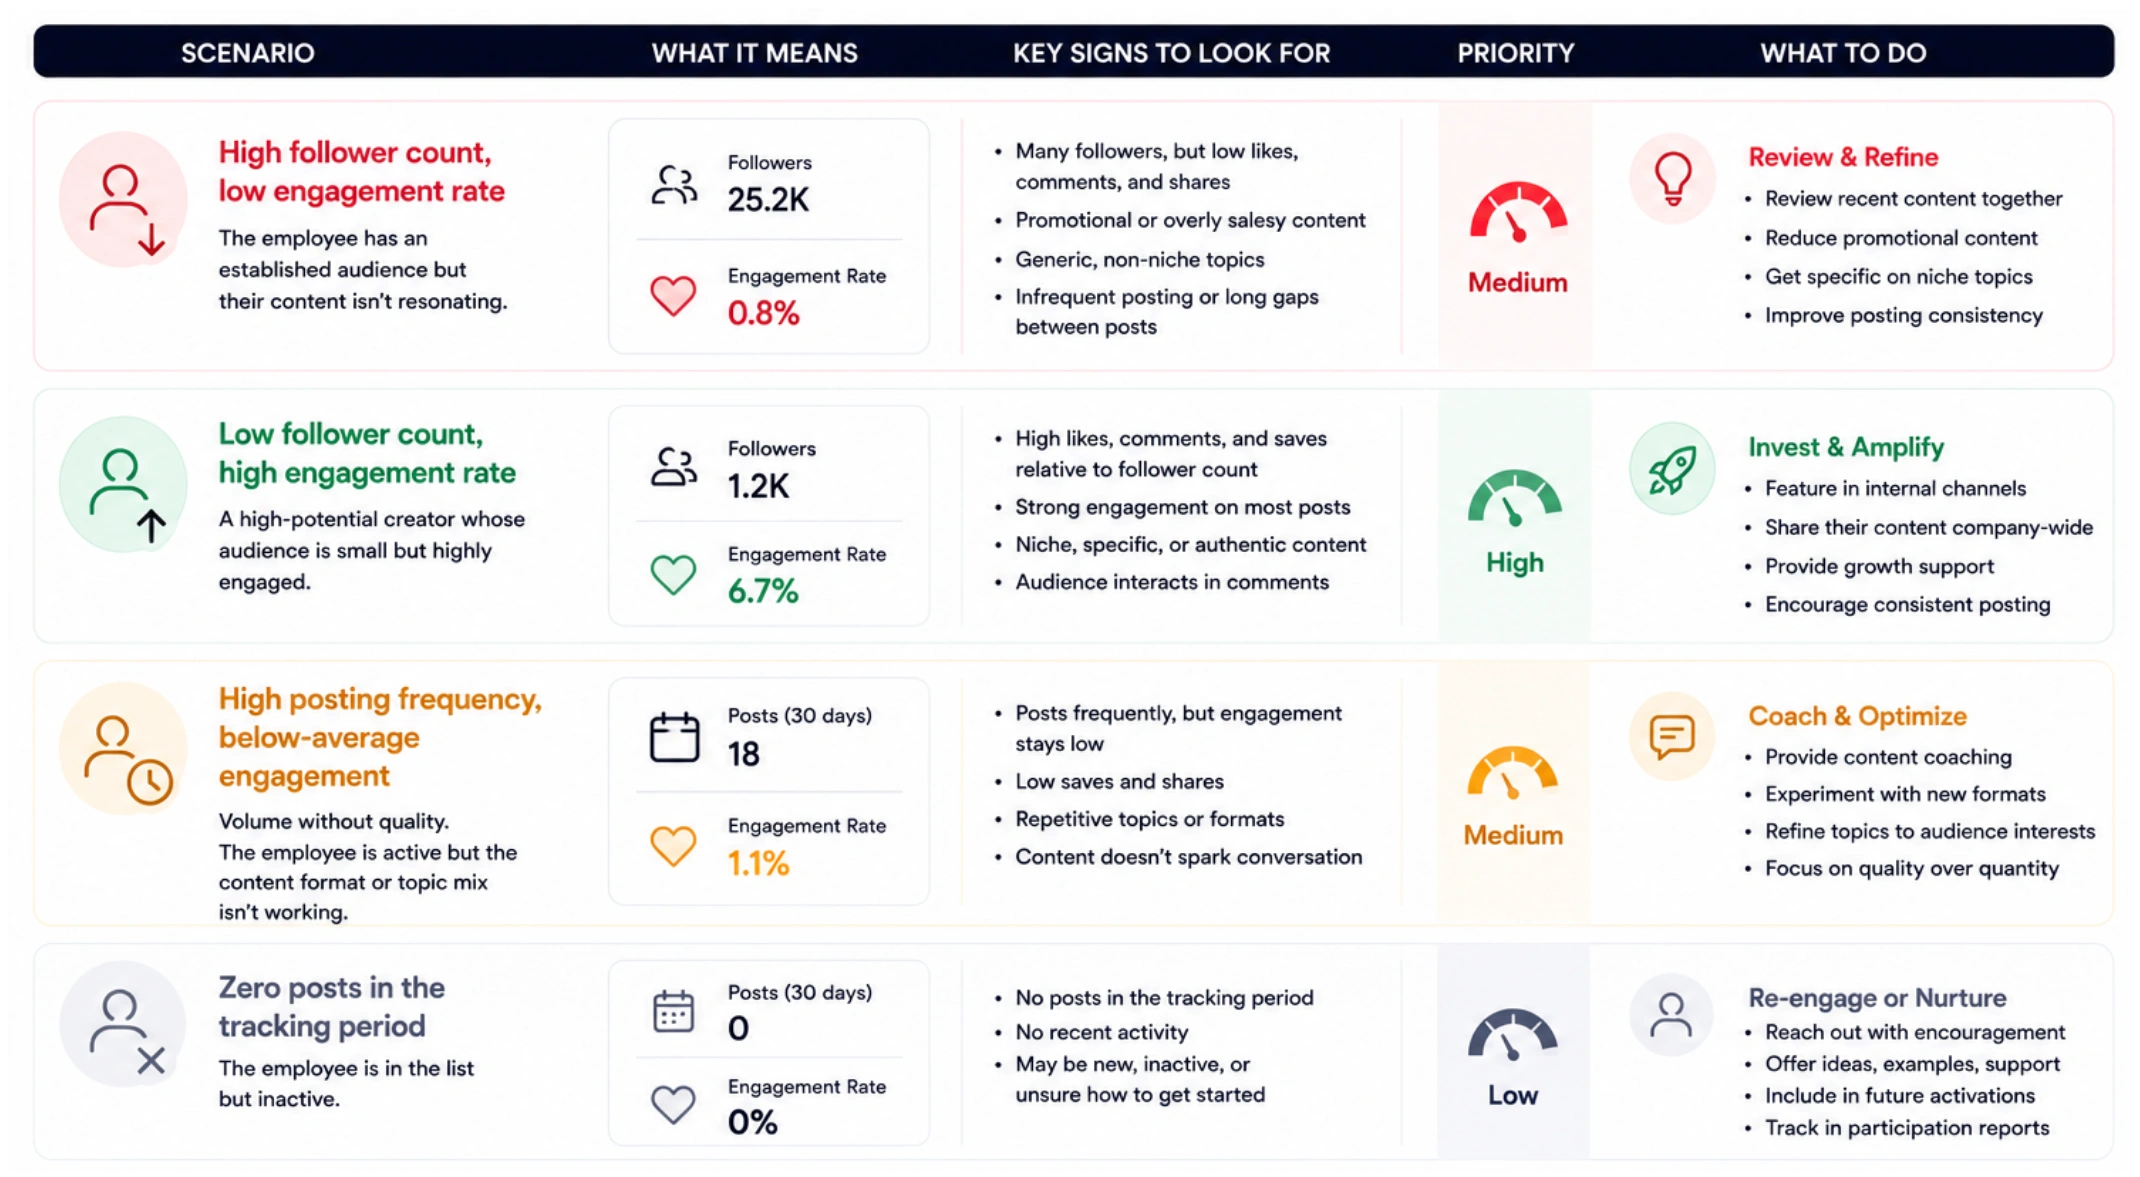
• High follower count, low engagement rate: the employee has an established audience but their content isn’t resonating. Review their recent posts — is the content too promotional, too generic, or too infrequent?
• Low follower count, high engagement rate: a high-potential creator whose audience is small but highly engaged. Prioritize growing their reach through internal amplification.
• High posting frequency, below-average engagement: volume without quality. The employee is active but the content format or topic mix isn’t working. Worth a content coaching conversation.
• Zero posts in the tracking period: the employee is in the list but inactive. This is useful data for your participation report — it’s not a failure, but it should be visible.
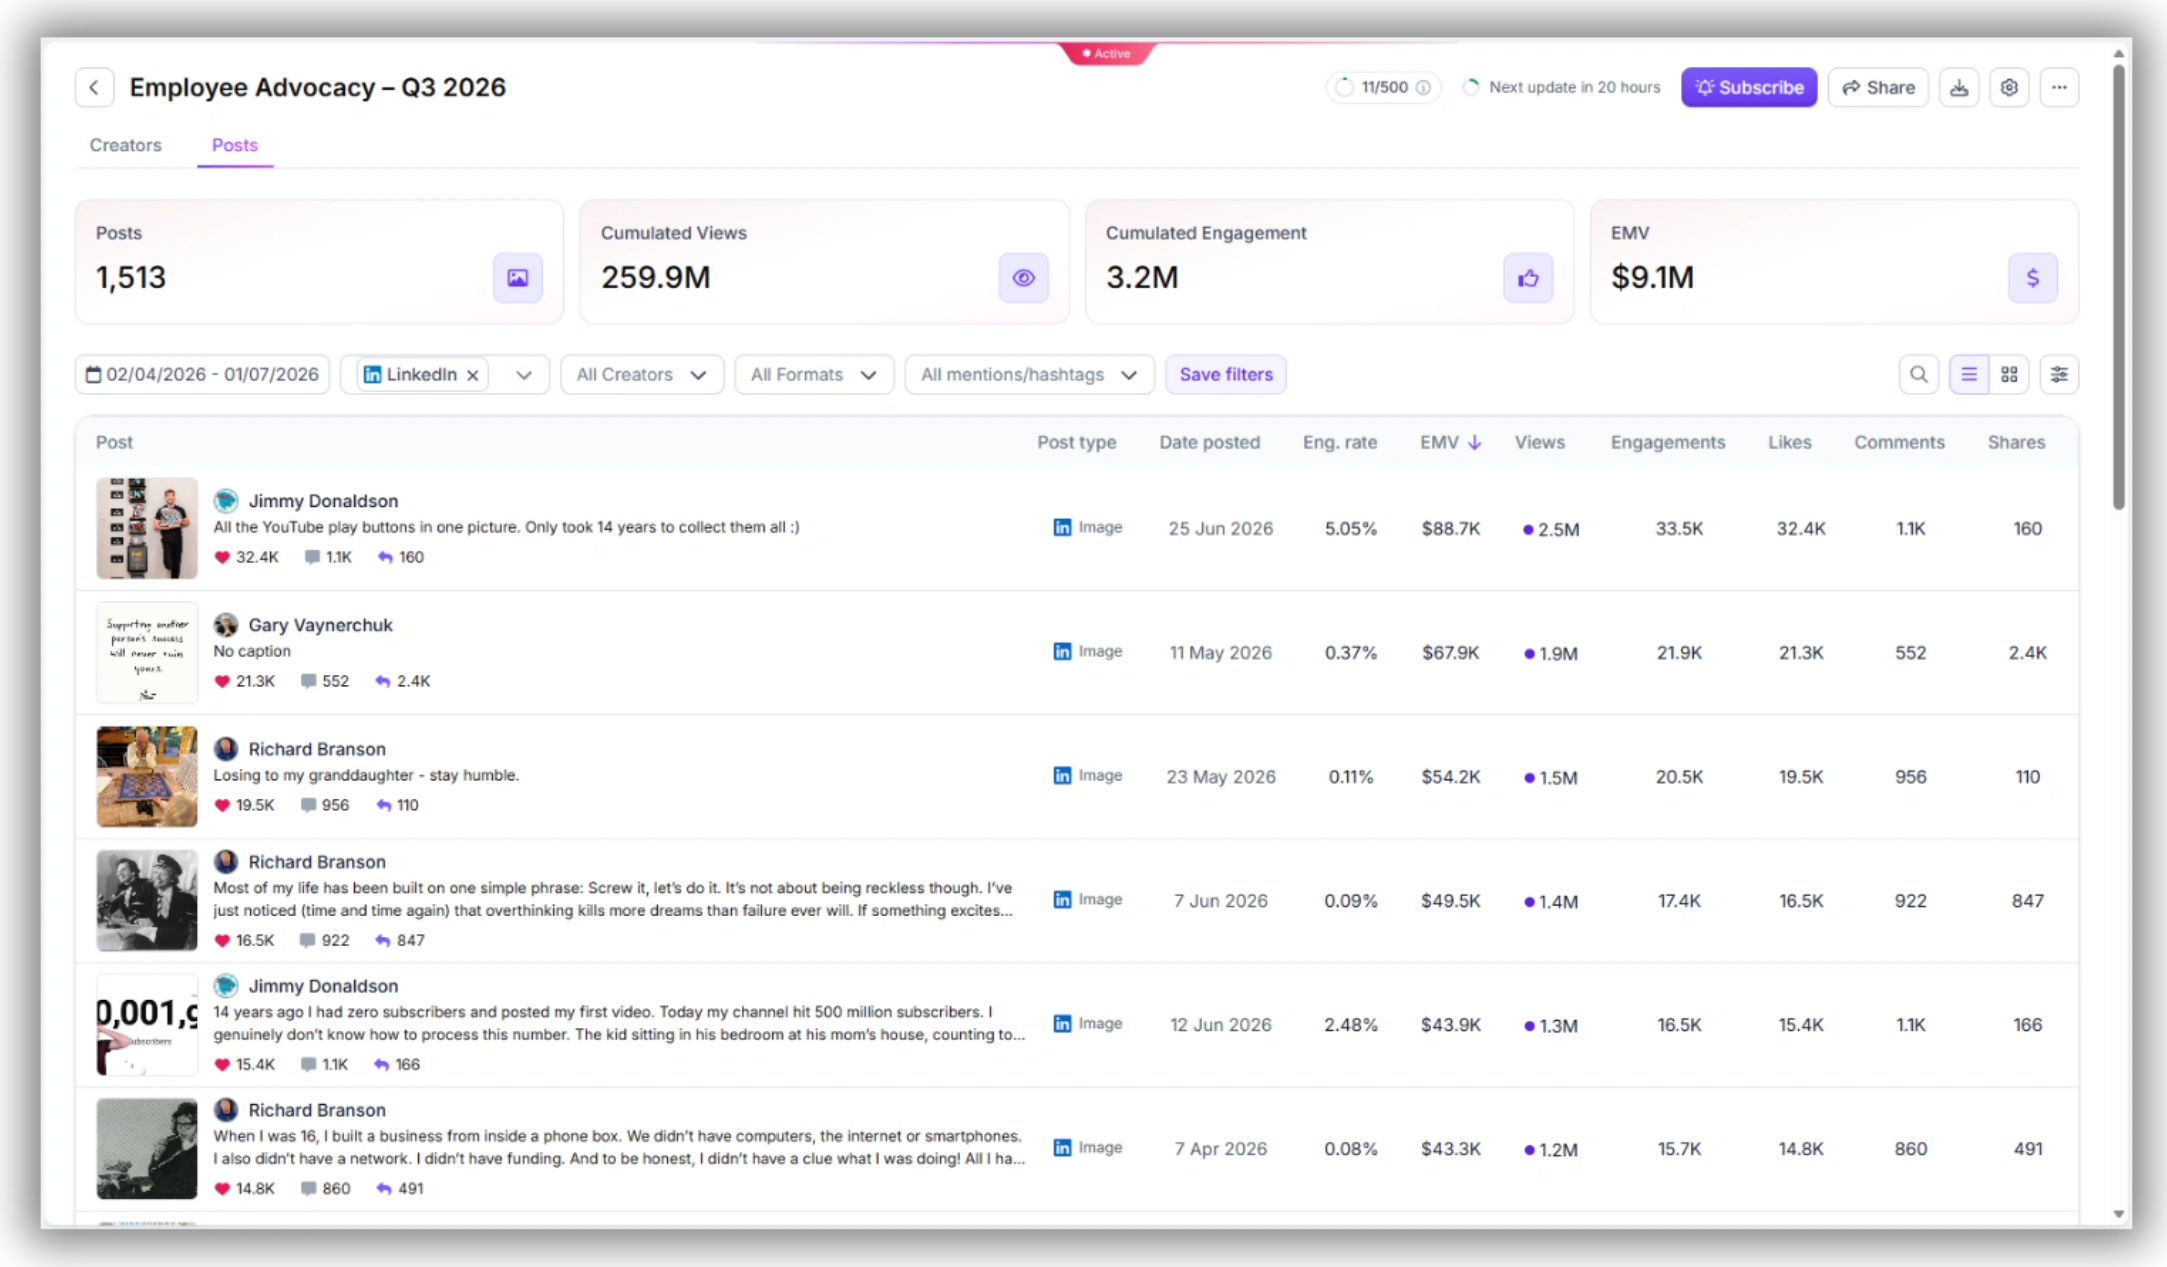
5. Running a Monthly Employee Advocacy Report with Tracker
The Tracker CSV export is the raw material for your monthly report. Here’s the workflow and what to do with the output.
CSV export workflow
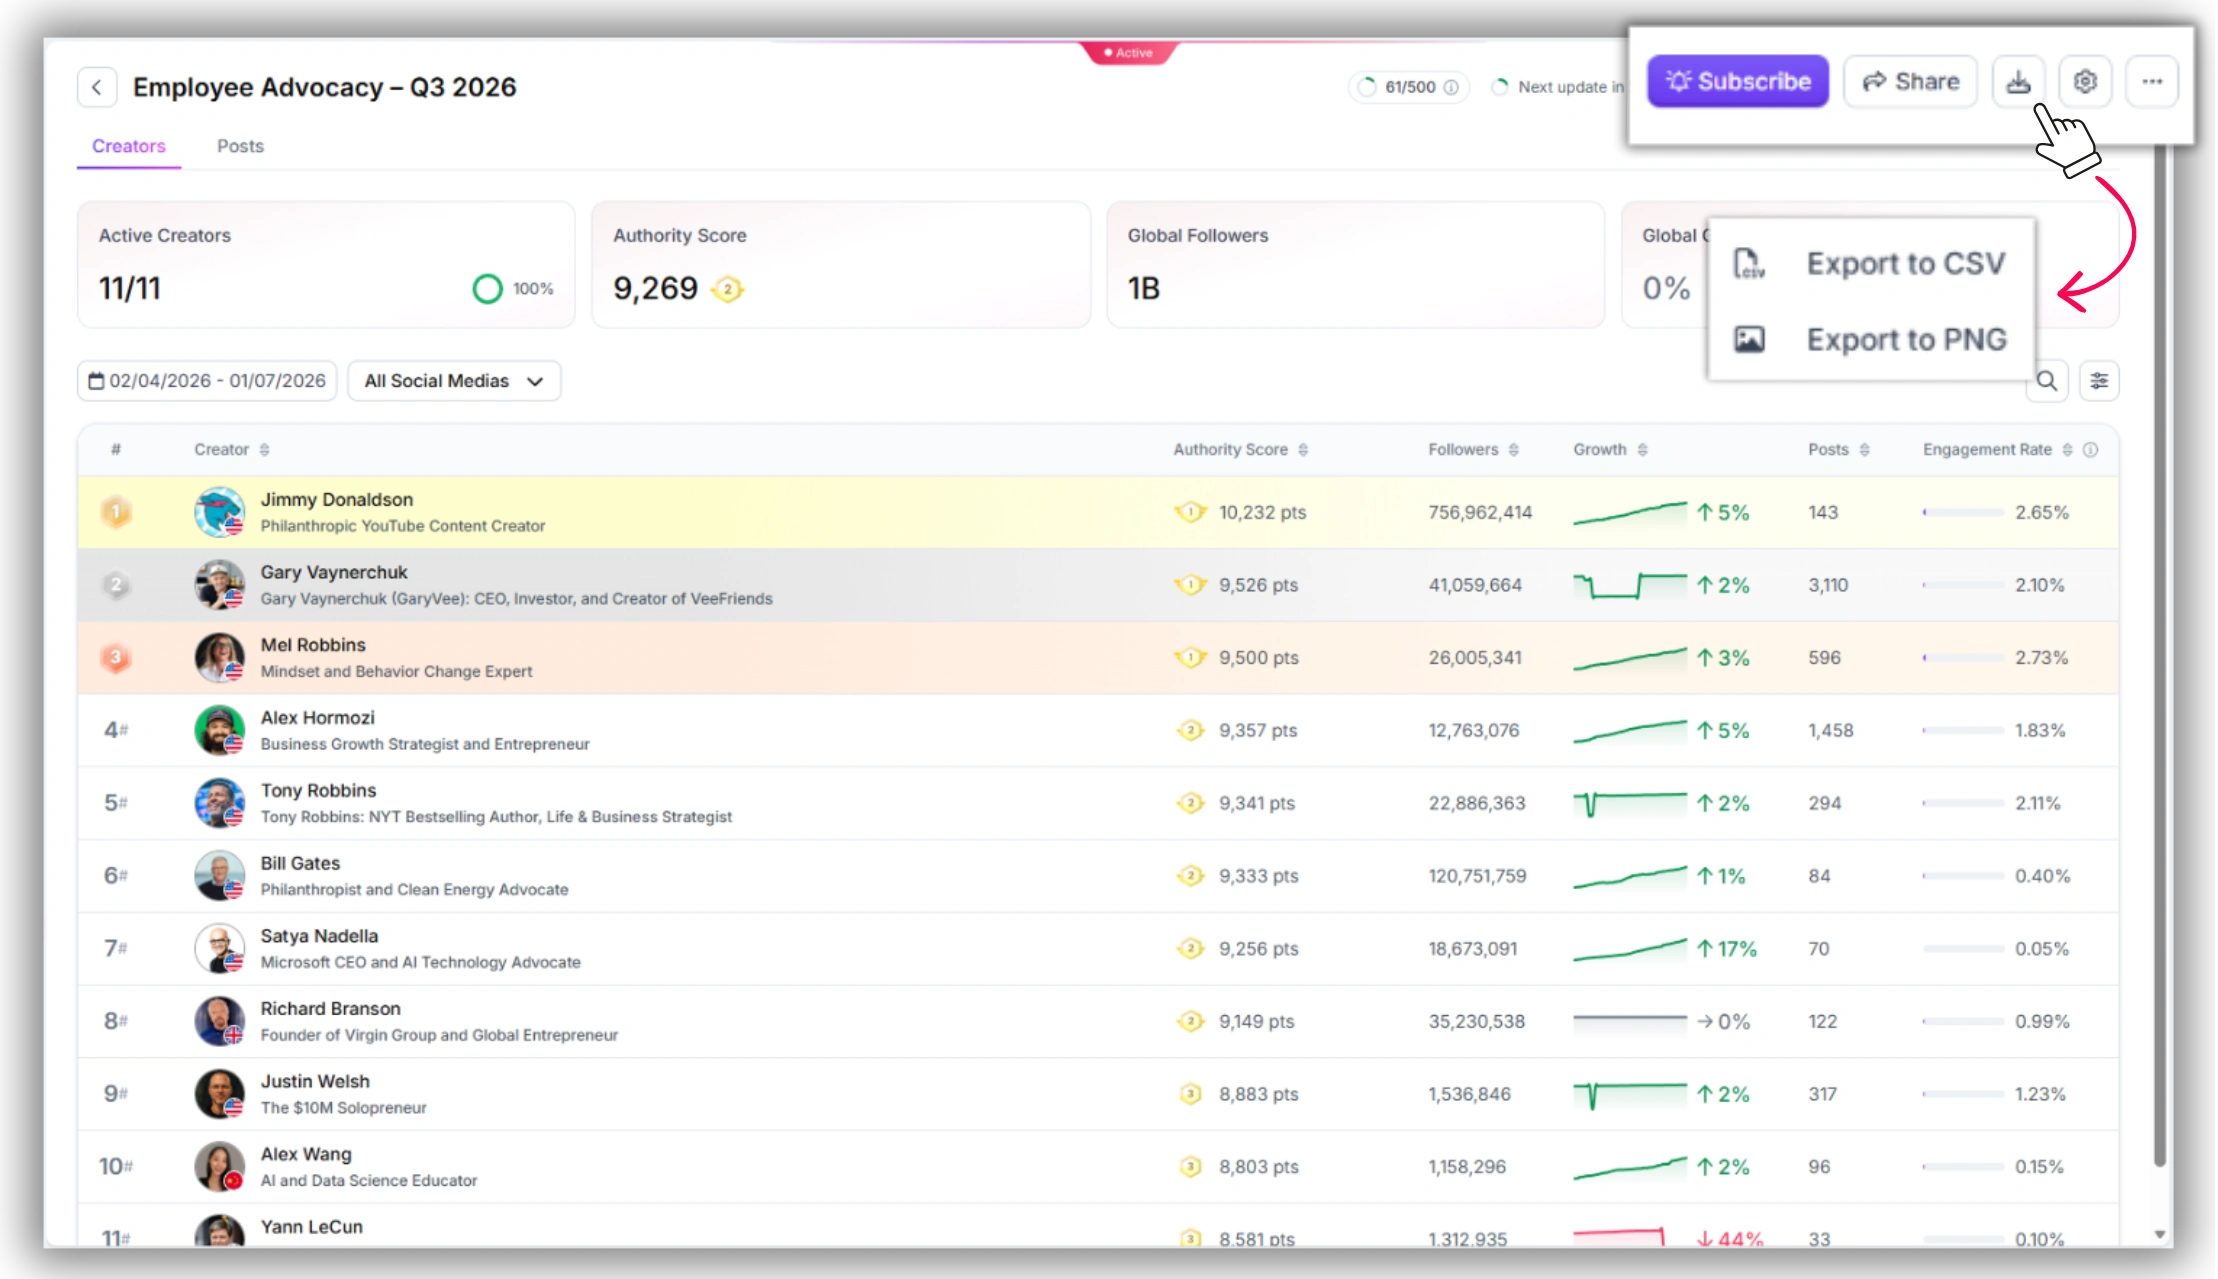
1. In the By Creator view, click Export (top right of the Tracker panel).
2. Select CSV format. The export includes one row per creator with columns for: Creator name, Platform, Authority Score, Followers (current), Follower change, Posts in period, Average engagement rate, Total EMV, and Total impressions.
3. Save the file with the date range in the filename — e.g. EmployeeTracker_June2026.csv. This makes quarter-over-quarter comparison straightforward.
What columns matter for the report
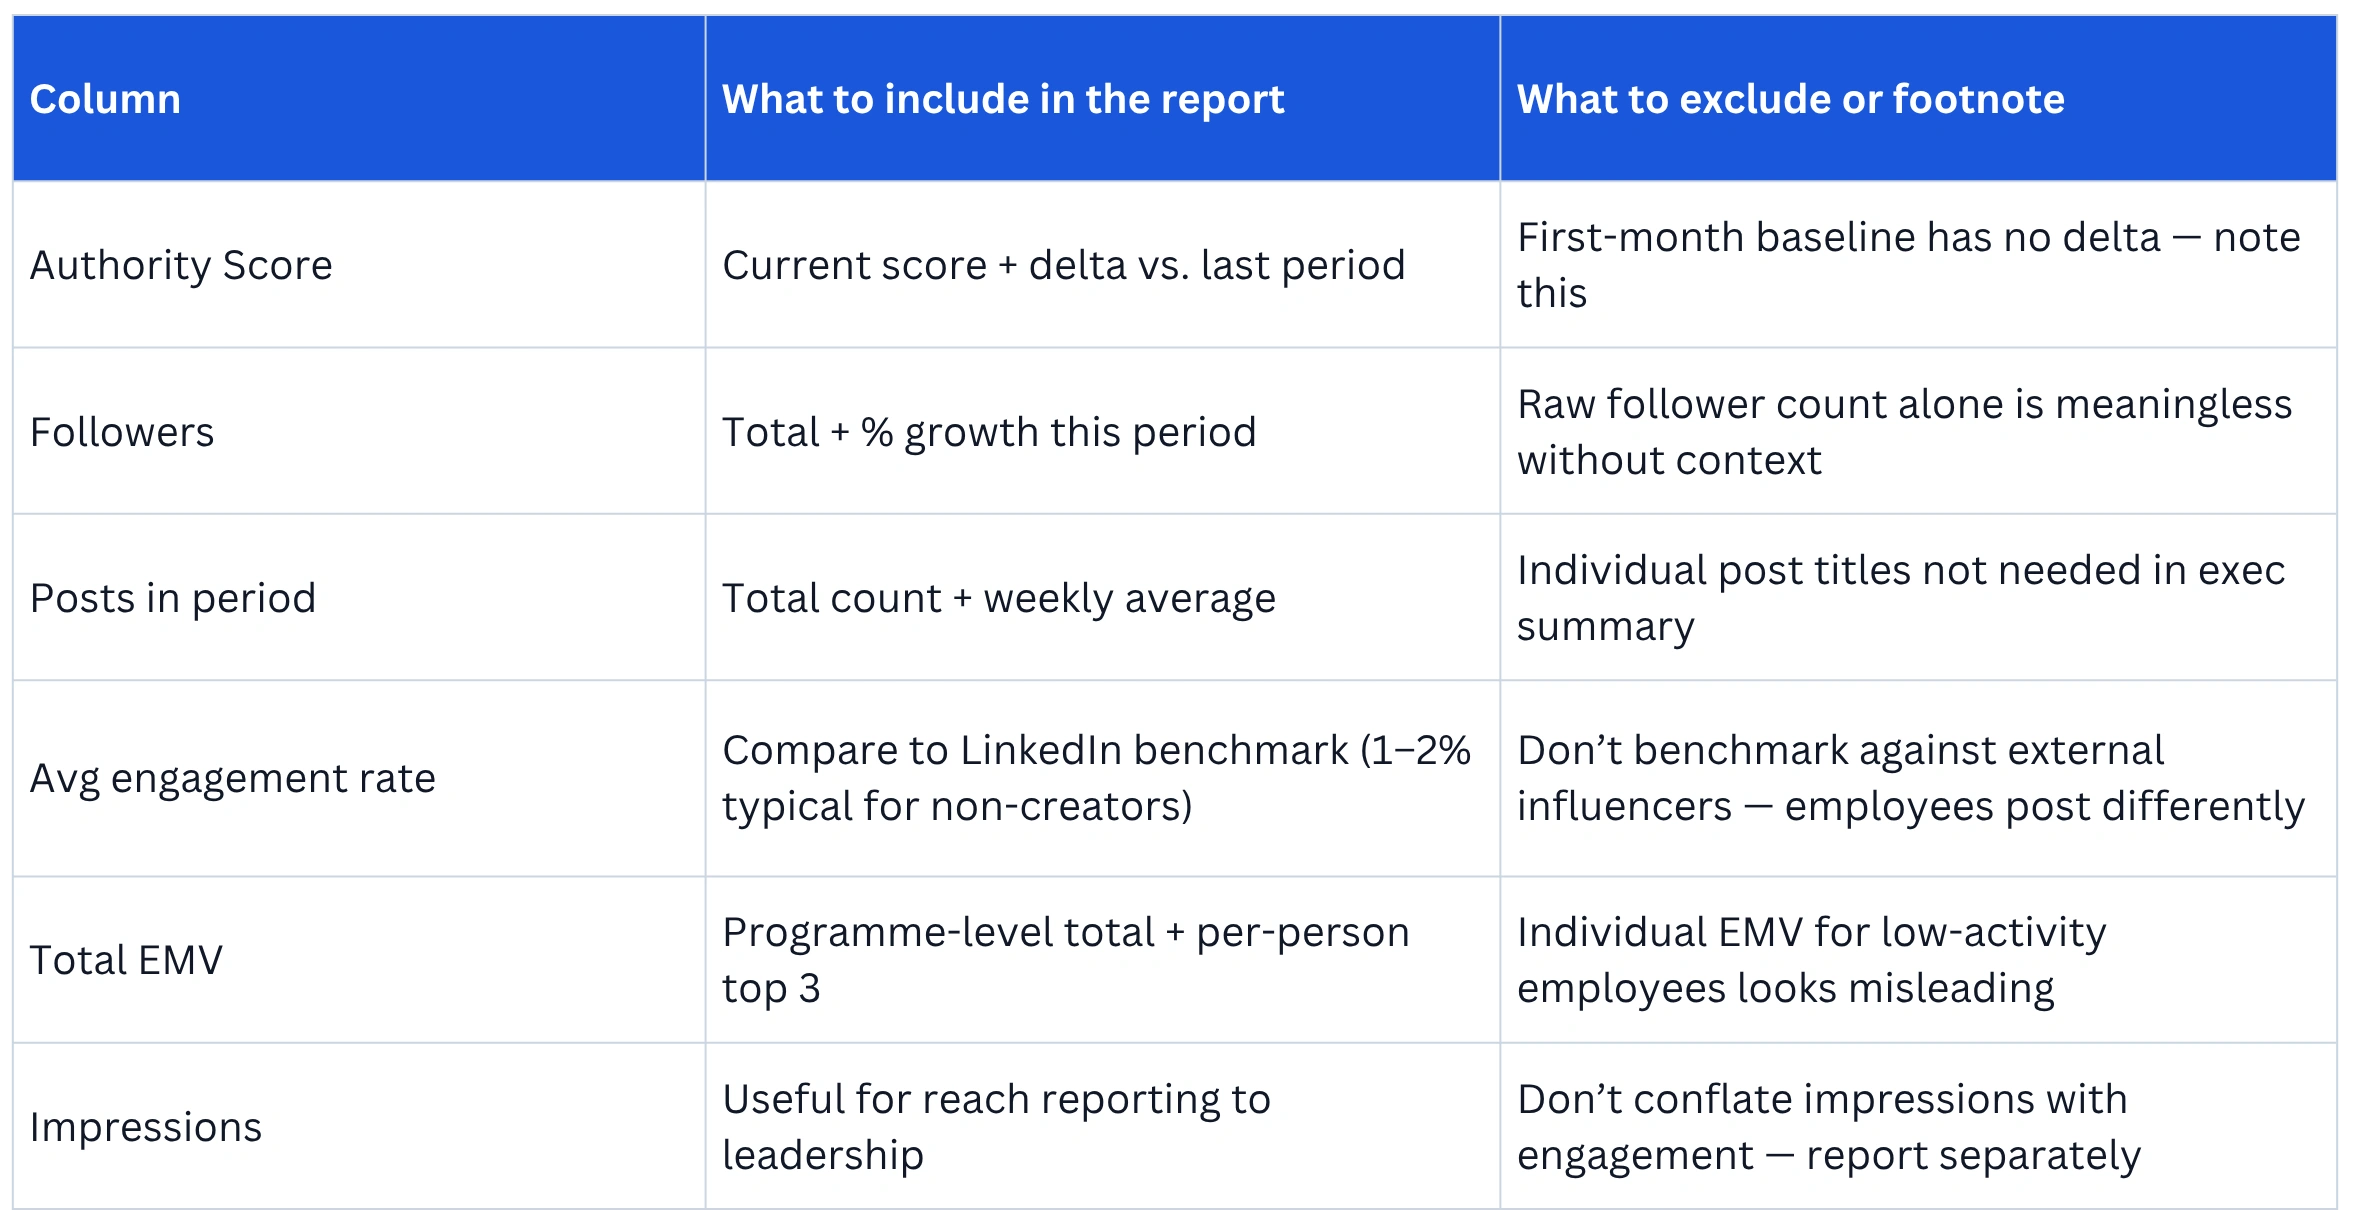
How to present this to leadership
One-page format. Three sections:
• Programme overview: total EMV generated, total impressions, total posts published, number of active employees (posted at least once in period) vs. enrolled employees.
• Top 3 employee influencers: name, Authority Score, key metric highlight (e.g. “+340 followers this month” or “4.2% avg engagement rate”). No need to include all employees in the exec summary.
• Quarter-over-quarter trend: one chart showing total EMV or total impressions across the last 3–4 monthly exports. This is the compounding value story — the number you want leadership to see growing.
Frequently Asked Questions
Q: What is the difference between employee advocacy analytics and employee social media monitoring?
A: Employee advocacy analytics typically refers to metrics tracked within a dedicated advocacy platform — participation rate, recommendation reshares, and content distribution reach from company-sourced posts. Employee social media monitoring is broader: it tracks an employee's independent social media activity, follower growth, engagement rate, and content performance across their own posts, not just company-distributed content. Favikon's Tracker does the latter — it treats each employee as a LinkedIn creator and measures their individual influence, not just their participation in a content distribution program.
Q: Can I track employees on platforms other than LinkedIn with Favikon?
A: Yes. Favikon tracks creators across 9 platforms including Instagram, YouTube, X, TikTok, and Substack. You can filter the Tracker By Creator view by platform, so if some employees are active on Instagram or X as well as LinkedIn, you can track all three in the same List. For most B2B advocacy programs, LinkedIn is the primary focus — but the multi-platform view is available.
Q: What metrics should I include in an employee advocacy report?
A: The five metrics that give a complete picture: Authority Score (influence quality), follower growth % (audience expansion), average engagement rate (content resonance), posts per week (consistency), and total EMV (financial value proxy). Avoid reporting participation rate or reshare count as primary metrics — they measure activity, not impact.
Q: How often should I run a Tracker report for employee performance?
A: Monthly is the right cadence for most programs. It’s frequent enough to catch employees who go inactive, spot fast-growing accounts worth amplifying, and track Authority Score movement — but not so frequent that the data lacks enough activity to be meaningful. Run a deeper quarterly review using a 90-day export to show compounding growth to leadership.
Q: Do employees need to sign up to Favikon to be tracked?
A: No. Favikon tracks publicly available LinkedIn data — posts, follower counts, engagement metrics. Employees don’t need Favikon accounts, and they don’t need to opt in. You add them to your List by searching their name or LinkedIn handle. The only requirement is that their LinkedIn profile is public. Private or restricted profiles won’t return data.
Also See 👀
➡️ HOW TO FIND TRENDING YOUTUBE TOPICS
➡️ HOW TO CHECK AN INSTAGRAM INFLUENCERS BRAND DEAL HISTORY
➡️ FAVIKON INFLUENCER DATABASE — 10M+ PROFILES
Related Articles
See all the articles
.webp)
.webp)


