How the Favikon Score Works (With Examples)
The Favikon Score measures creator performance using four key factors: reach, engagement, audience, and consistency. Learn how each factor affects a creator's score, see real examples, and understand how Favikon ranks creators across social platforms.

How the Favikon Score Works
Every creator on Favikon has a score. It decides where they land in Favikon Rankings, which tier they're in, and how they show up when a brand goes looking for creators. A number with that much weight should come with the working shown.
So here it is. We've rebuilt the Favikon Score from scratch. It now runs on one formula, with the same weights for every creator on every network. I'll walk you through each part, with a sample creator along the way, soyou can see exactly how the numbers add up.
The formula in one picture
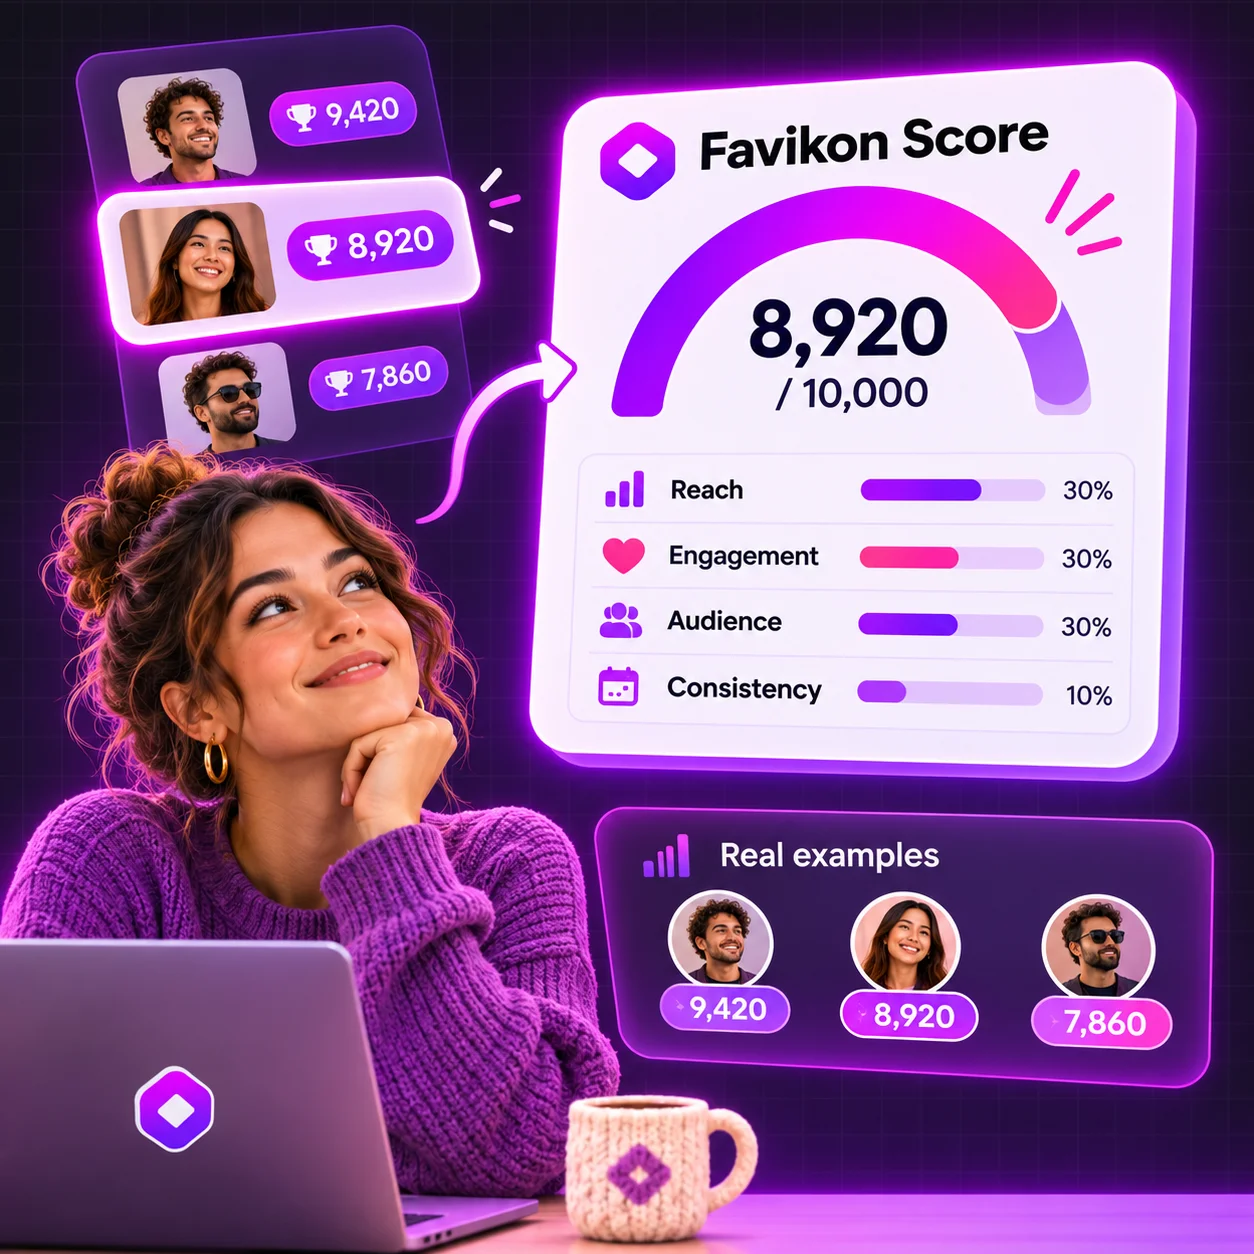
The Favikon Score is an influencer score built from four things:
• Reach (30%): how many people actually see your posts
• Engagement (30%): how many of them like, comment or share
• Audience (30%): how many people follow you
• Consistency (10%): how often you post
We then multiply the result by an authenticity factor. Real engagement earns a small boost, and fake engagement gets expensive.
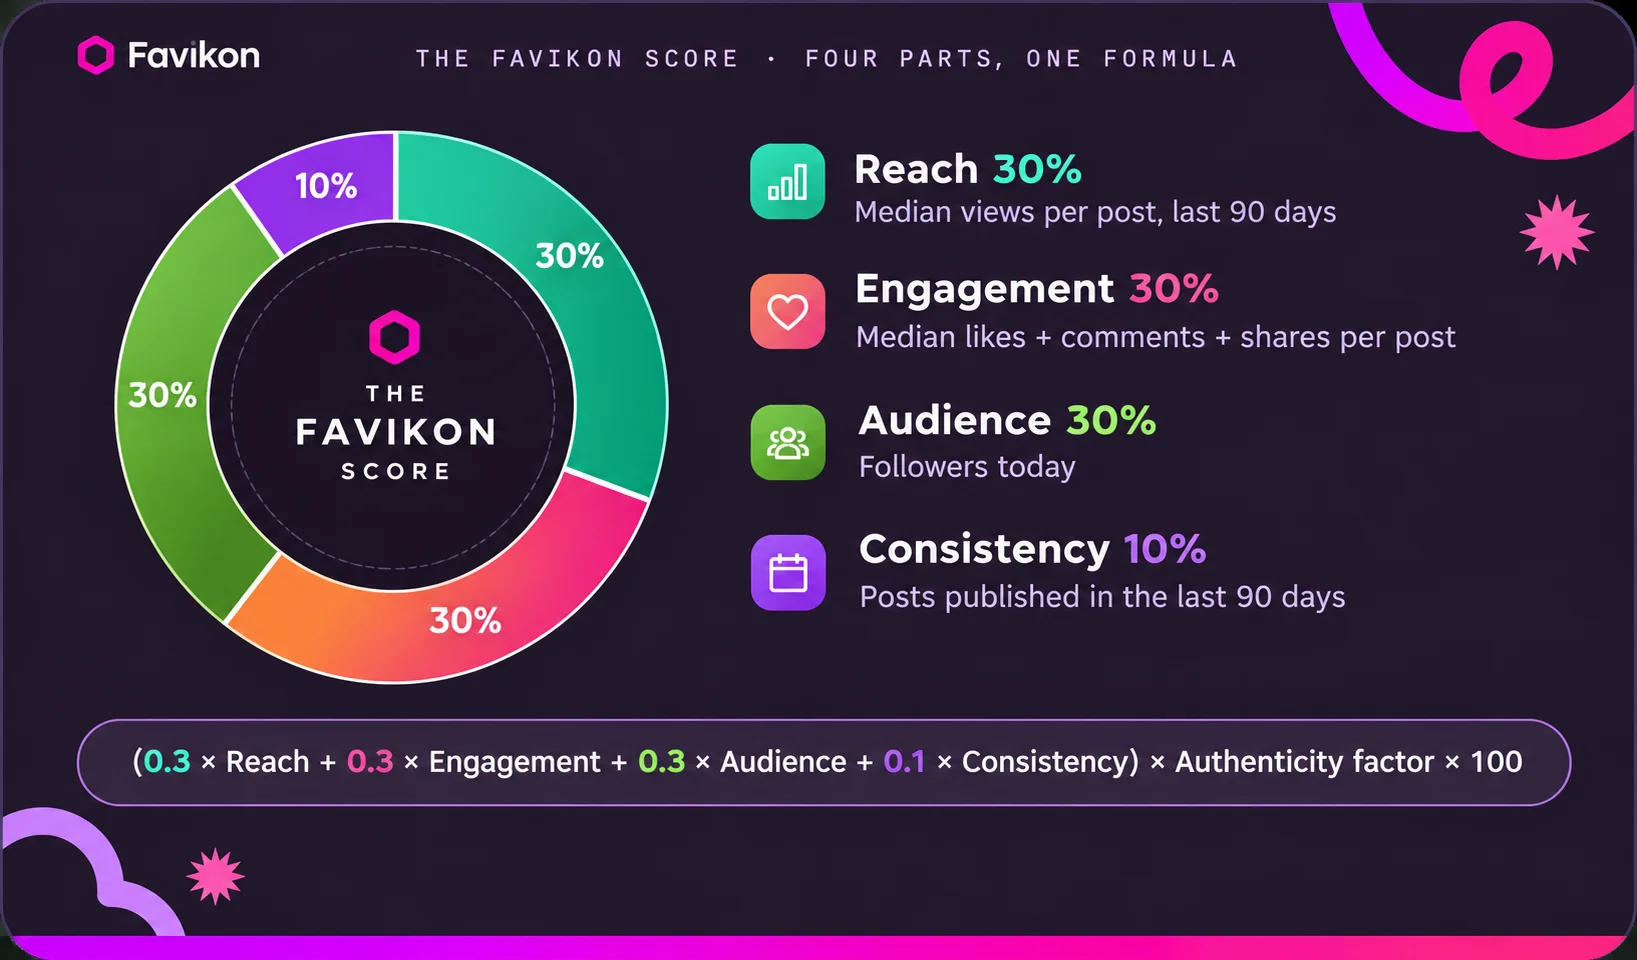
Each part is scored from 0 to 100, and the authenticity factor runs from ×0.50 to ×1.15. So a network score goes from 0 to 11,500 points. In the app it's rounded to the nearest point, so you'll see something like "8 320 pts".
One score per network
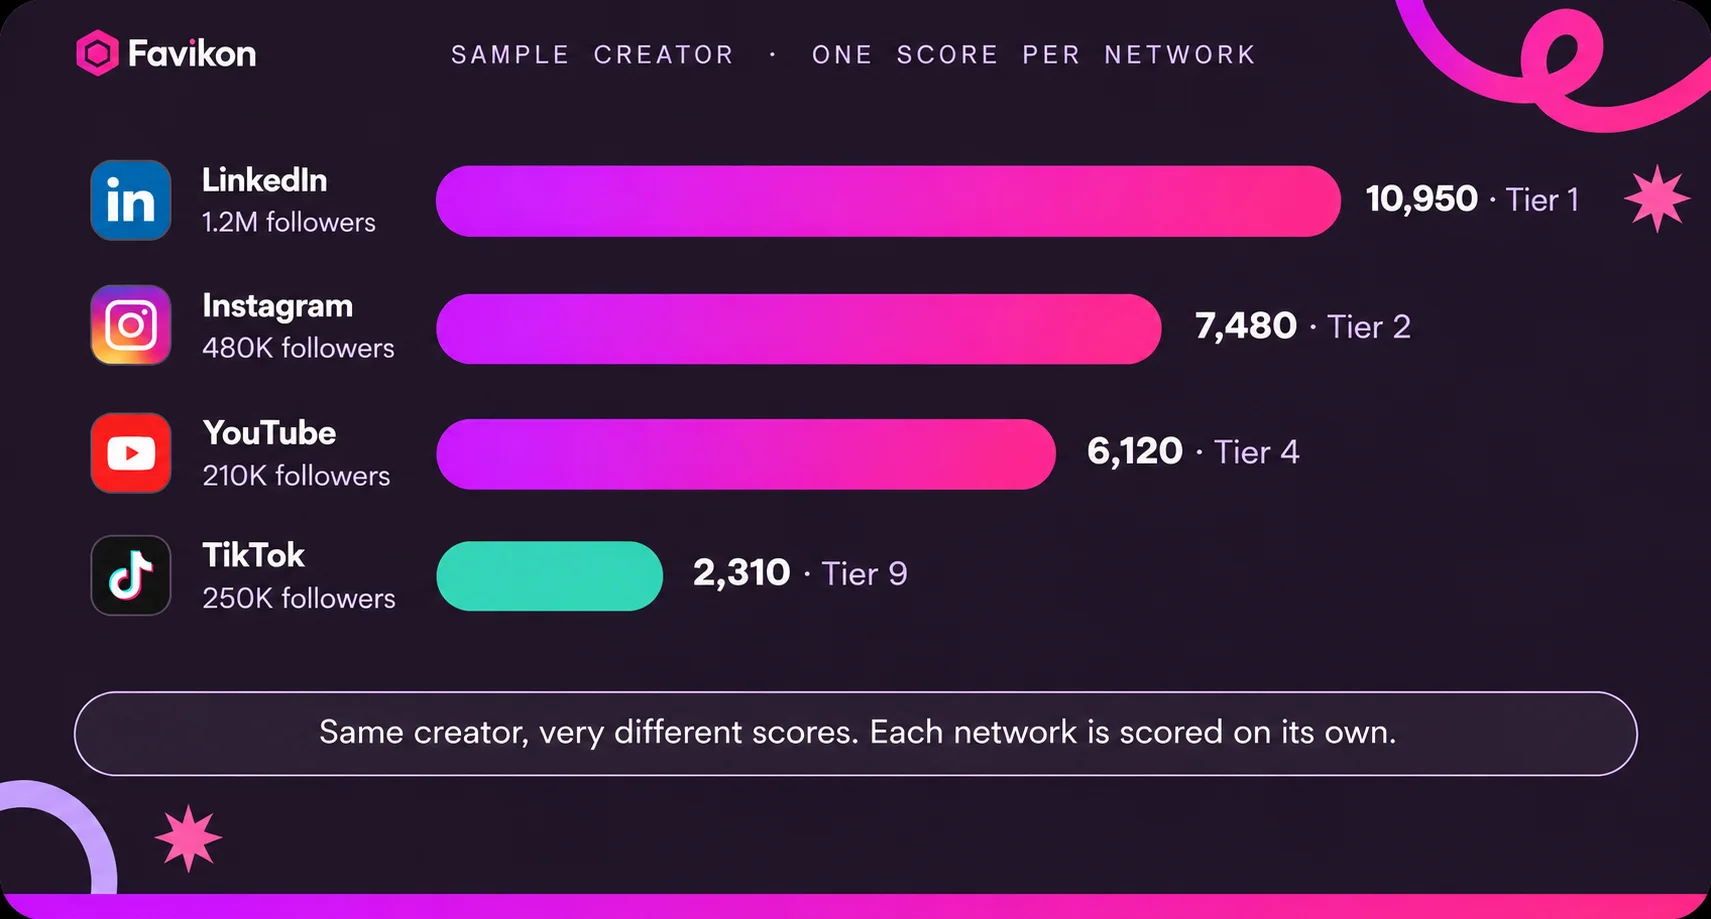
You get a separate score on LinkedIn, X, Instagram, TikTok and YouTube, because the same person can have a very different presence on each.
Take a sample creator who has built their audience mostly on LinkedIn.With 1.2M followers there, they're Tier 1. On TikTok, they have 250K followers but farfewer views and posts, so they score 2,310: Tier 9.
On top of the network scores, every creator gets a Global score that looks at all their networks together. We add up their median views, median engagements, followers and posts across every scored network, then run those totals through the same formula and weights. On the Global score, authenticity works one way only: it can pull youdown, never up. Each network weighs in according to how much of your presence itcarries, which is the average of its share of your views, your engagement and yourfollowers. A network with 80% of your views, 60% of your engagement and 50% ofyour followers carries about 63%. The Global score runs from 0 to 10,000, and it wouldonly drop by half if every one of your networks had the worst possible authenticityscore. It's a calculation of its own, so it won't match your best network or the averageof your networks.
Reach, Engagement and Audience: how you compare
Three of the four parts are percentiles. We line you up against every other creator on the same network and see where you land. A Reach of 90 means your posts get more views than 90% of creators on that network.
• Reach uses your median views per post over the last 90 days.
• Engagement uses your median likes, comments and shares per post over the same 90 days.
• Audience uses your follower count today.
Why medians? Because one viral post shouldn't define you. If you post 20 times and one blows up, your median barely moves. Same if one flops. (LinkedIn doesn't publish view counts, so there we estimate them at 75 × likes + 75 × comments + 125 × reposts. On Instagram, photos and carousels without a view count are estimated at 30 × their likes and comments.)
Percentiles also explain something that surprises people at the very top. Two LinkedIn creators, one with 40 million followers and one with 400K,can end up less than a point apart on Audience. Once you're ahead of almost everyone, being further ahead adds very little, and the score turns to what you do with that audience.
Who you're compared with:
• Everyone on the same network. We don't split by country, niche or size, so a LinkedIn creator in Lyon is ranked against every LinkedIn creator we track.
• Only active creators. The comparison group is every creator who posted at least once in the 90 days before their latest data update. Brand accounts are left out. Updated monthly. We rebuild the comparison groups on the 1st of each month, and your score picks up the new groups the next time your data is refreshed. In between, your percentile only moves when your own numbers move.
• Updated monthly. We rebuild the comparison groups on the 1st of each month. In between, your percentile only moves when your own numbers move.
For the curious, here's the exact percentile. Creators tied with you count for half.
Percentile = (Creators below you + 0.5 × Creators tied with you) ÷ Total creators in the comparison group × 100
Consistency: how often you post
Consistency is the only part that isn't a percentile. It's a fixed scale: 25 posts in 90 days gets you the full 100. Below that the curve is steepest at the start, so your first few posts count the most. Going from 0 to 4 posts takes you to 40. Going from 16 to 25 adds the last 20.
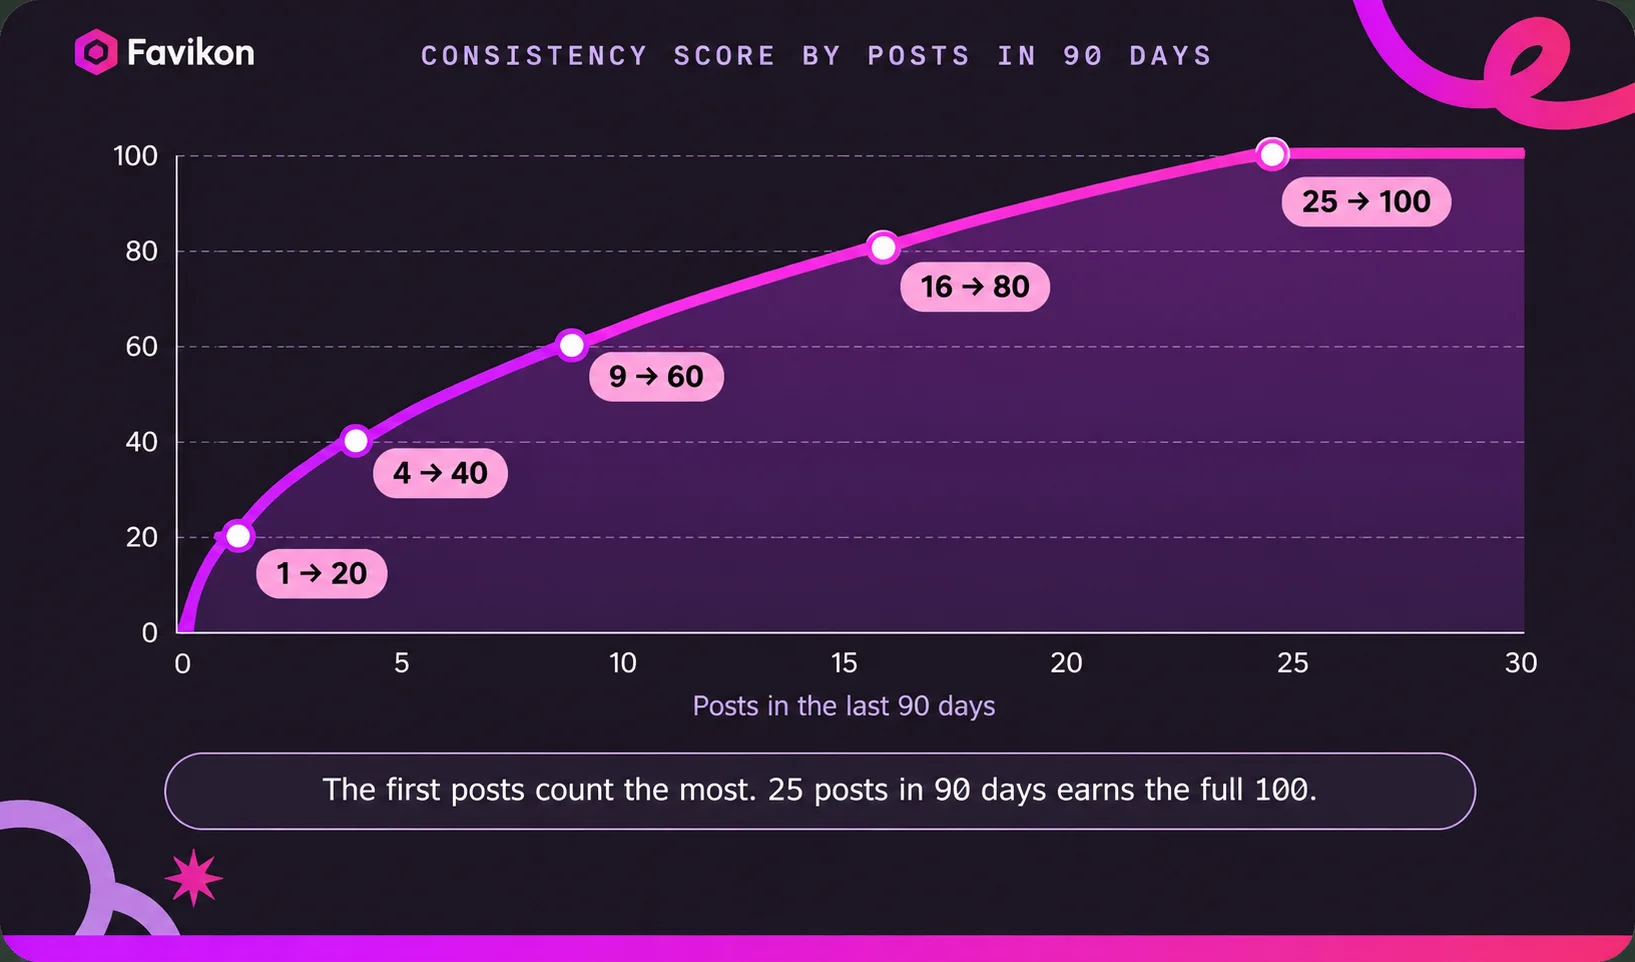
Consistency = 100 × the smaller of 1 or the square root of (Posts in 90 days ÷ 25).
Only the count matters. Twenty-five posts in one busy week scores the same as twenty-five spread over three months.
The authenticity factor
Big numbers mean less when the engagement behind them isn't real. That's why the last step multiplies the score by an authenticity factor between ×0.50 and ×1.15.
The factor has no effect at an authenticity score of about 78. Above that, your score gets a boost of up to 15%. Below it, your score can lose up to half. The steepest part of the curve is between 70 and 85, where each authenticity point moves your score by almost 2%.
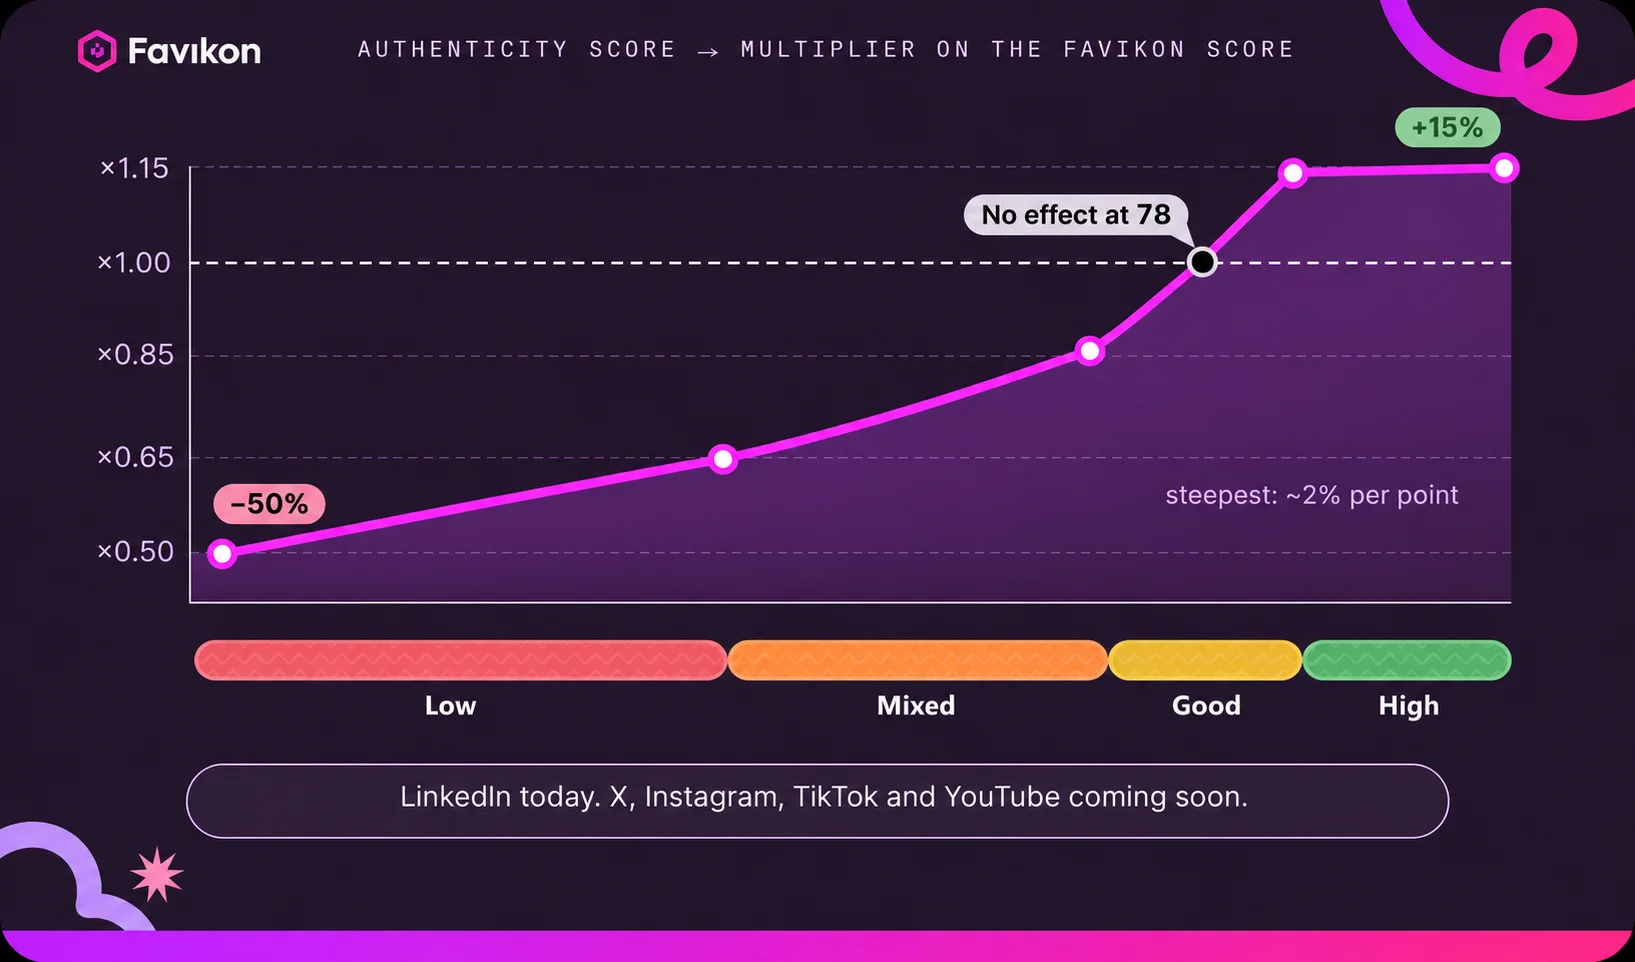
Right now the factor applies on LinkedIn, using the checks describedbelow. X, Instagram, TikTok and YouTube are coming soon. Until then they stay at×1.00, and so does any creator we haven't scored yet.
How we spot fake engagement on LinkedIn
We read a creator's recent posts, at least a day old and with 5+ comments, and up to 30 of their comments each, most-liked first. We measure each sign of engagement that isn't genuine across their latest 30 scored posts from the last 90 days, then subtract the points from 100.
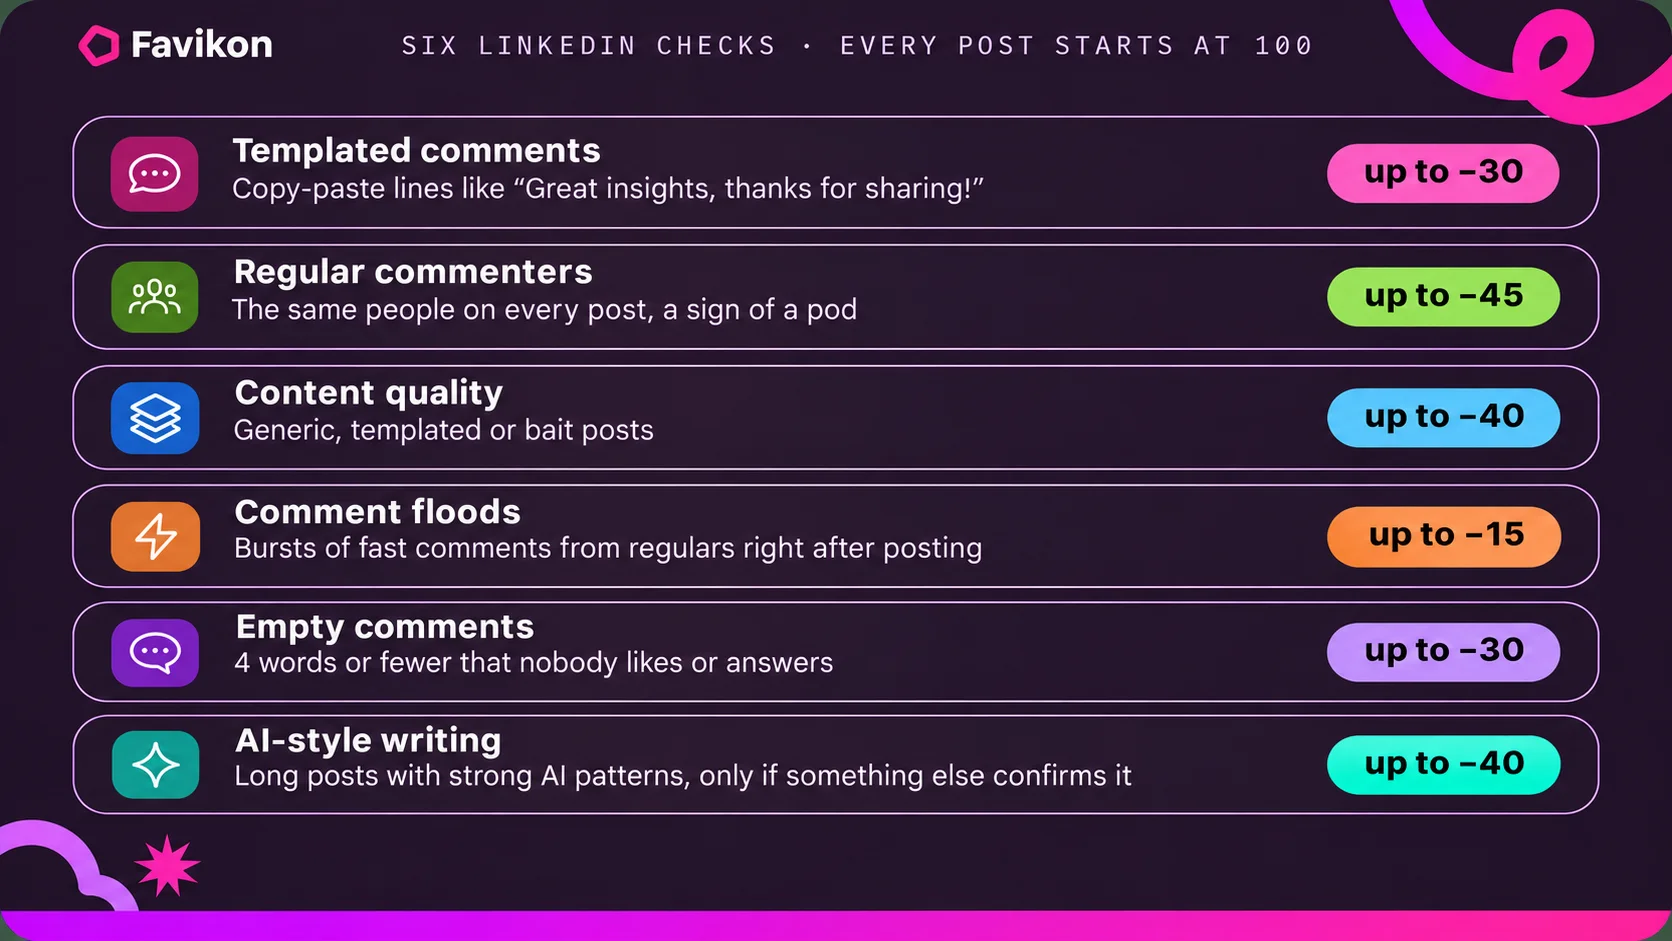
• Templated comments. Templated comments. Copy-paste lines. A comment counts when it shows two of three signs: an opener shared with other comments, nothing personal or specific to the post, and the same length as several other comments. −1 point per % of comments. A template from a regular commenter counts in full; one from a one-time commenter counts for a quarter. Up to −30.
• Regular commenters. Comments written by people who commented on at least half of the creator's 9 other most recent posts, the classic sign of an engagement pod. The first 5% of comments are free, then −1 per % up to 20%, then −2 per %. Up to −45.
• Content quality. We grade each post's content: is it specific to the creator's field, insightful and original, or generic, templated or bait? A post about the news or someone else's work is judged on what the author adds to it. The creator's own announcements and team news are left out. When the average is under 70, each point under costs 1 point. Up to −40.
• Comment floods. Posts with at least 3 times the comments per reaction of creators the same size, where regulars pile in within 15 minutes and the creator replies to fewer than 30% of comments. Comment-to-receive giveaways don't count. −3 per flagged post, up to −15.
• Empty comments. Four words or fewer, with no likes and no replies except the creator's. The first 20% are free, then −1 per %. Skipped on announcements and team news. Up to −30.
• AI-style writing. Long posts (100+ words) with at least two strong AI-writing patterns, or an AI-generated image. We only measure it once a creator has 5 long posts. The share is the flagged posts divided by the long posts plus 2, so one or two flagged posts don't swing a small sample. The first 30% is free, then −1.5 per %, up to −40.
One rule matters a lot here: AI-style writing only costs points when something else backs it up, such as regular commenters, comment floods, empty comments, or an audience quality under 35. Writing with AI tools isn't fake engagement, and we don't treat it that way.
Audience quality: the ceiling
The checks catch fake signals. Audience quality catches something subtler: an audience that's real but empty. For each scored post, our AI rates four things from 0 to 100, and the tab shows them as:
• Conversation: do commenters talk with the creator and with each other?
• Audience match: do they bring knowledge relevant to the topic?
• Post substance: is the post itself worth something?
• Comment depth: do comments add something real?
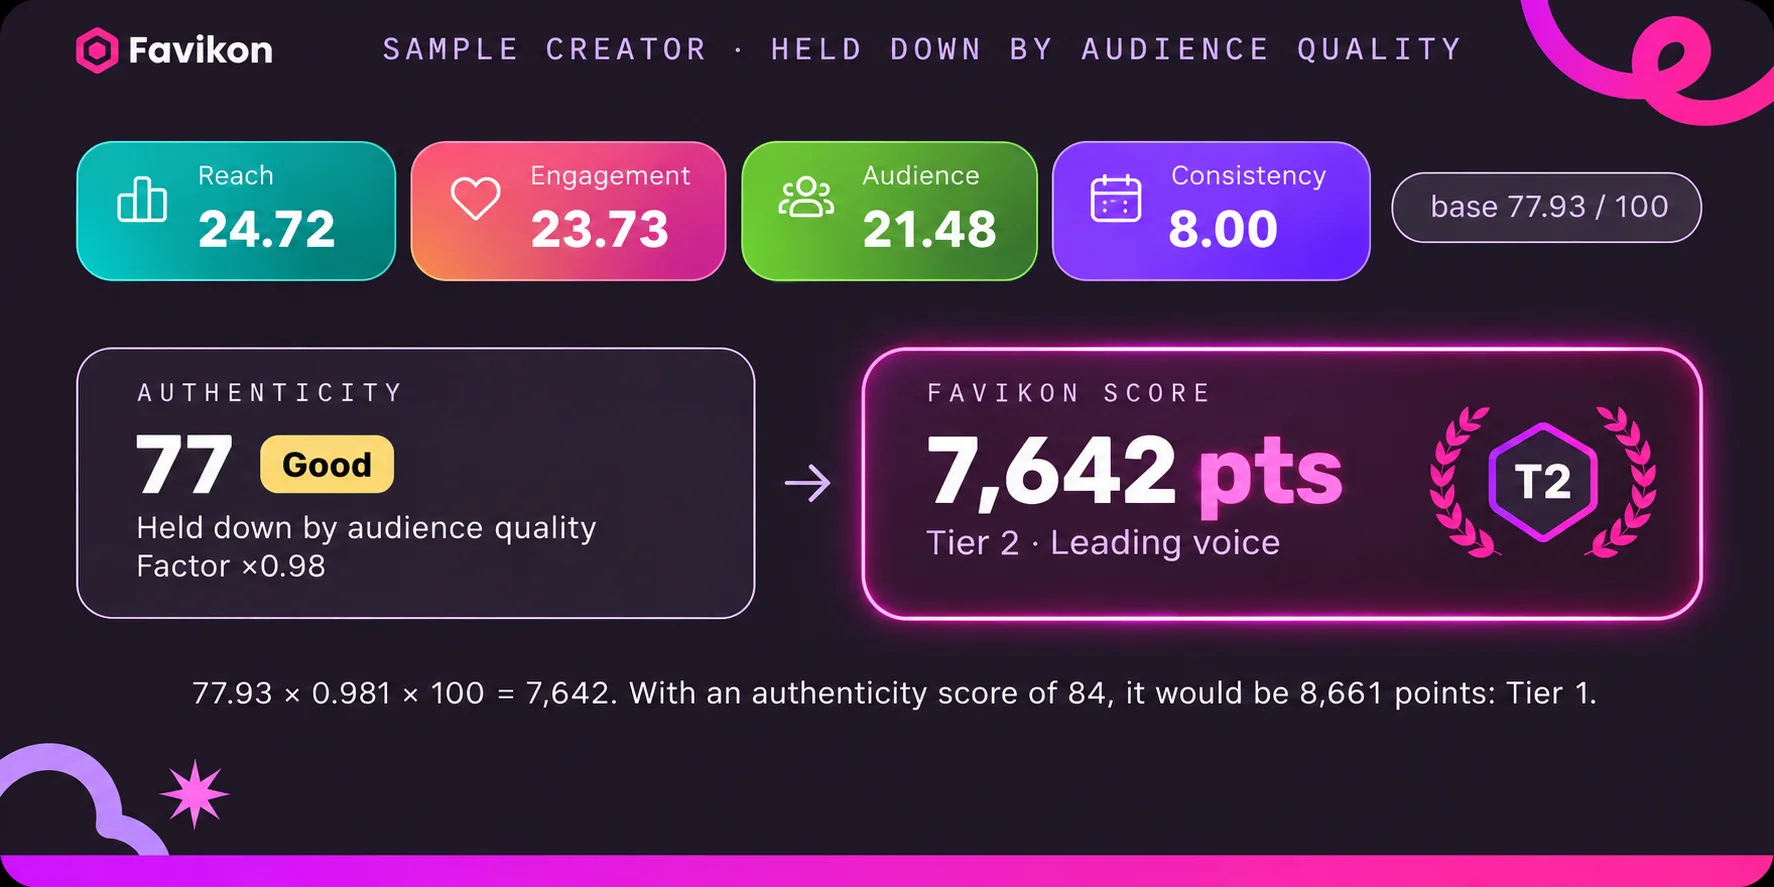
Audience quality is the average of the four, each taken as the median across the creator's scored posts. When it drops below about 47, it puts a ceiling on the authenticity score: at 40 the ceiling is 80, at 35 it's 65, at 30 it's 50, and it never goes below 10. A creator with an audience quality of 60 isn't affected at all.
Here's what it looks like when it does kick in. Take a sample LinkedIn creator whose checks come out at 84 but whose audience quality is 39. Their ceiling is 3 × 39 − 40 = 77, so their authenticity score is 77 and the tab shows that audience quality "Holds the score down".
Two content penalties. Last, we look at the creator's 20 most recent posts. If half or more are quote cards or list graphics with little substance, the authenticity score is multiplied by 0.75. If 30% or more ask readers to comment to get something (a PDF, a guide), it's multiplied by 0.75 too. Both can apply.
With a base of 77.93, that's 7,642 points and Tier 2. Without the ceiling, the same creator would be at 8,661 points and Tier 1. On LinkedIn, the quality of your comment section can be worth a whole tier.
If you want to dig into a creator's authenticity yourself, the full breakdown lives on the Authenticity tab of any profile in Favikon creator analytics. And if you're vetting Instagram accounts, our guide on how to check for fake followers covers what to look for while Instagram scoring is on its way.
See any creator's authenticity breakdown
Influencer tiers: from score to tier
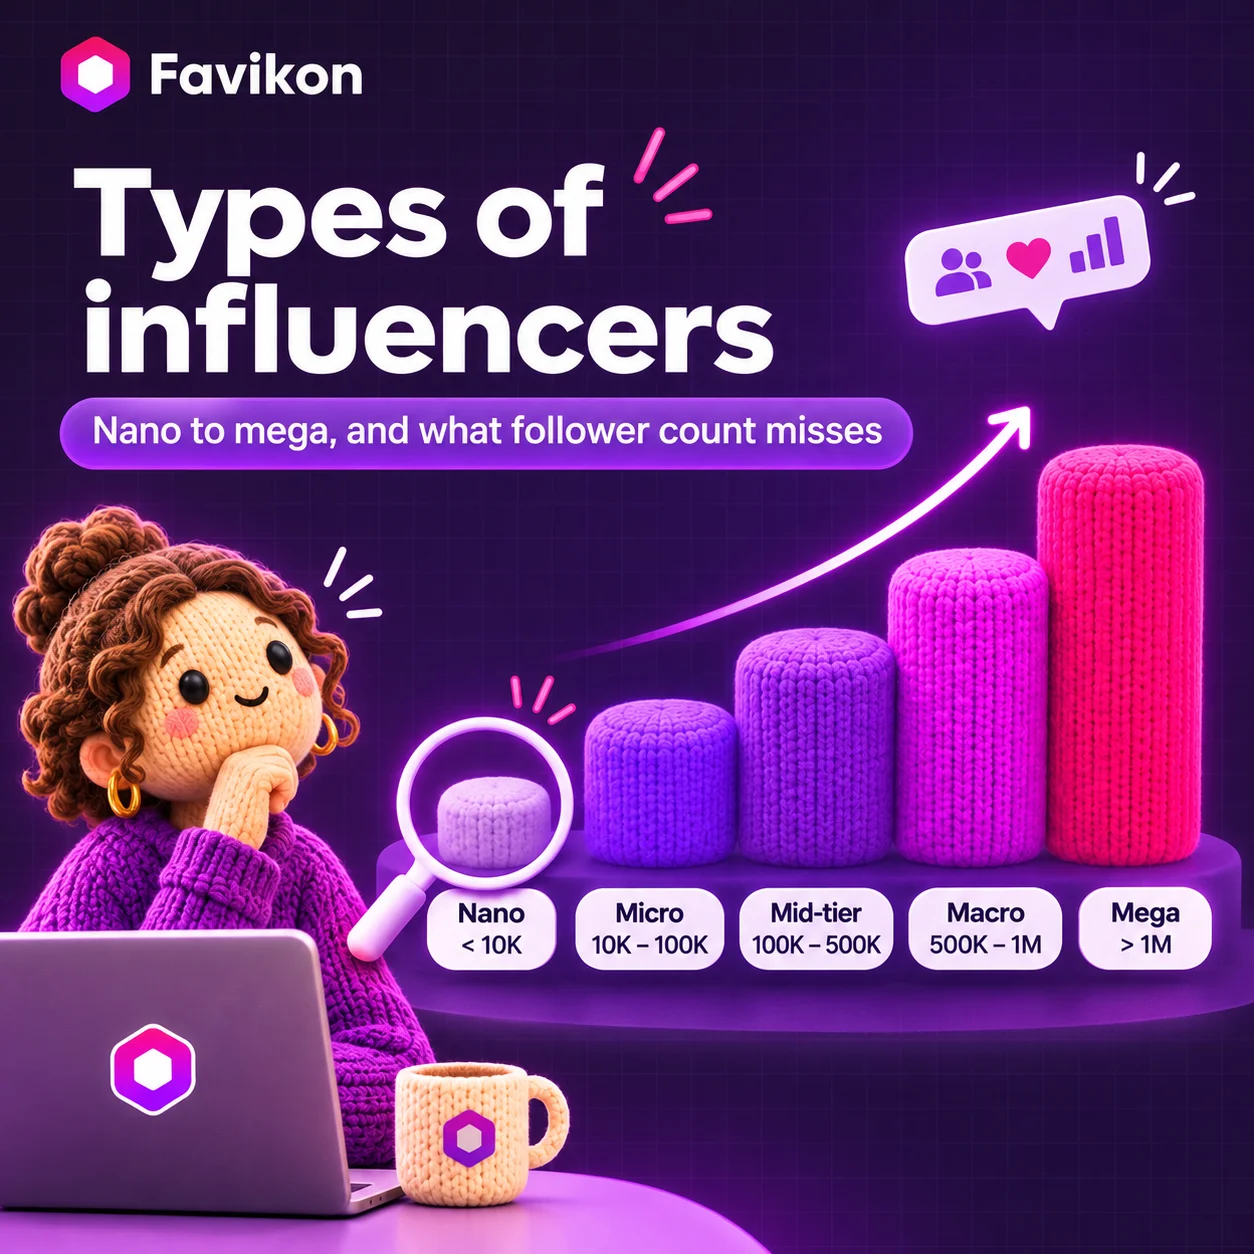
Most influencer tiers you'll find online (nano, micro, macro, mega) are based on follower count alone. Ours are based on the whole score. By follower count, our sample creator's 250K on TikTok would makethem a macro influencer. By Favikon Score, they're Tier 9 there, because reach, engagement and consistency matter as much as audience size.
Every score lands in one of 10 tiers. The same point ranges apply to every network, to the Global score and to brand accounts.
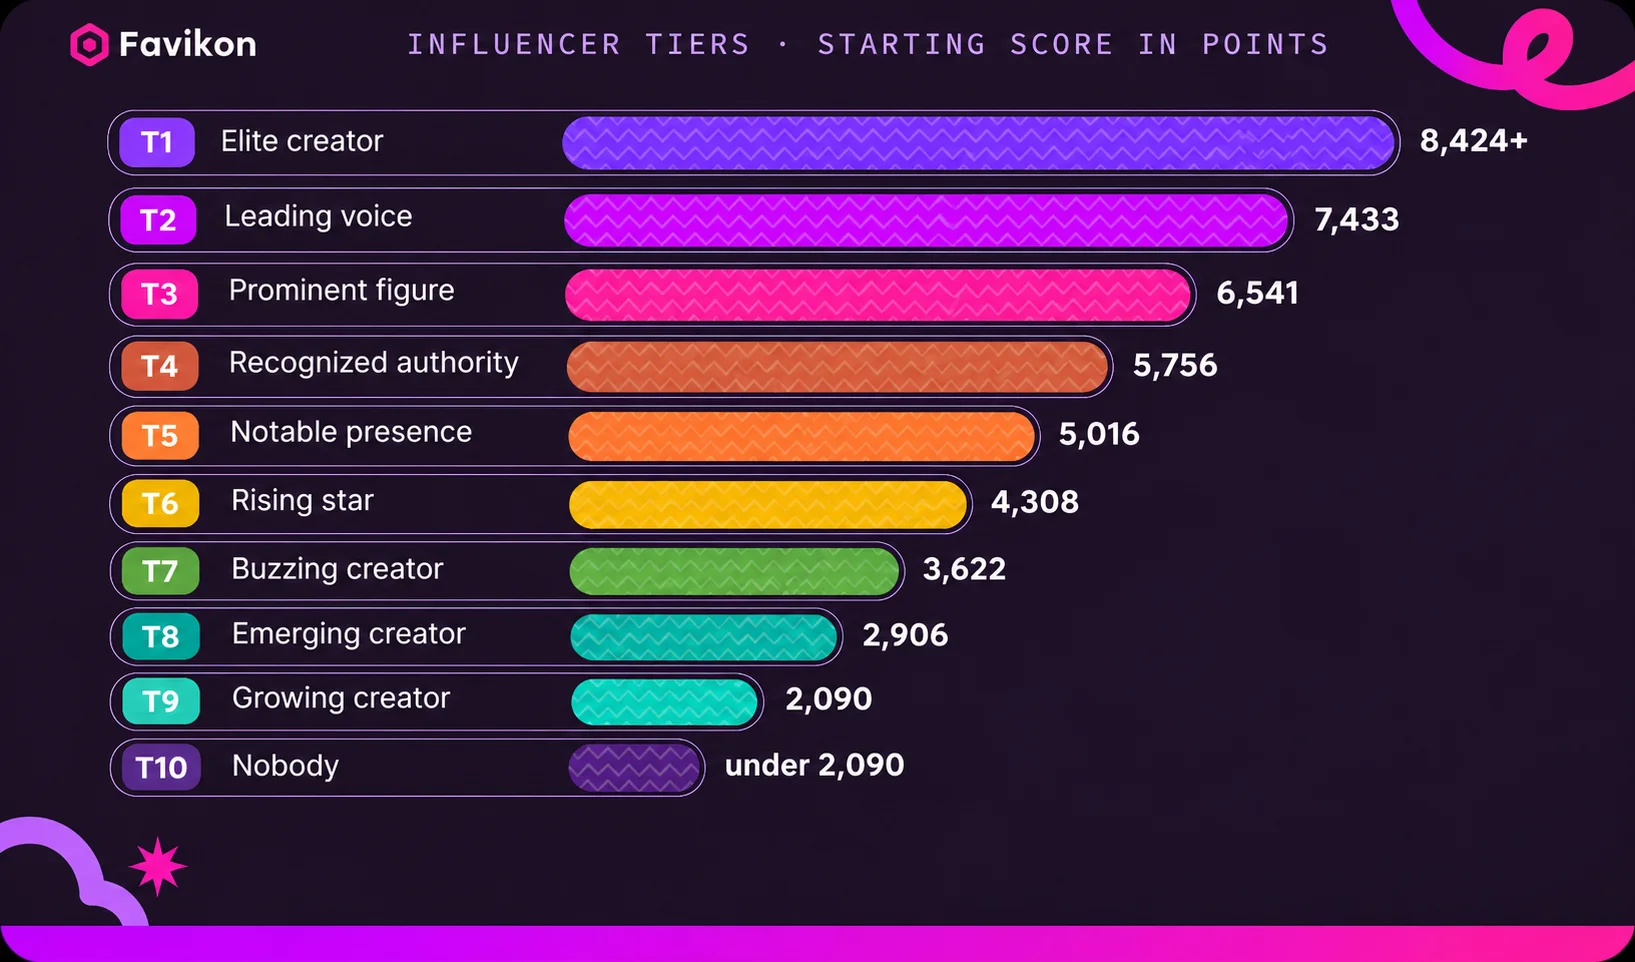
The ranges are set in points, so other creators growing won't push you into a lower tier. You move when your own score crosses a line. Your score can still shift a little when the comparison groups are rebuilt each month.
Who gets a Favikon Score
Anyone with an account on LinkedIn, X, Instagram, TikTok or YouTube. There's no minimum follower count and no minimum number of posts. Twitch, Snapchat, Pinterest and Substack aren't scored yet.
When your score updates
Your score is recalculated every time your data is refreshed. How often that happens depends on where you're looking:
Frequently asked questions
What is a good Favikon Score?
Anything from 8,424 points up is Tier 1, Elite creator. To see how a score really stacks up, compare it with creators in the same niche and country on the Favikon leaderboards.
Why did my score change with the update?
The formula is new. Reach, engagement and audience now compare youwith everyone on your network, and on LinkedIn, authenticity now multiplies yourscore. On October 27, we removed the old authenticity multiplier on every network. X no longer has one.
My score moved, but I didn't post. Why?
Usually one of two things. Your data was refreshed and your 90-day window moved with it, so older posts dropped out and your follower count changed. Or the comparison groups were rebuilt on the 1st and your data has been refreshed since.
Can a score go above 10,000?
A LinkedIn score can, up to 11,500, with a high authenticity score. The Global score can't: authenticity can only lower it.
How do I improve my Favikon Score?
Post regularly (25 posts in 90 days maxes out Consistency), write posts people actually stop for, and end them with a question that gets specific answers. On LinkedIn, engagement pods, templated comments, generic posts and comment-gated giveaways lower your authenticity factor, and that pulls the whole score down.
How does Favikon detect fake engagement?
On LinkedIn, six checks look for templated comments, the same commenters on every post, generic content, bursts of fast comments, empty comments and AI-style writing. Two content penalties catch template cards and comment-gated posts. An audience-quality ceiling catches audiences that are real but empty. The same approach is coming to X, Instagram, TikTok and YouTube.
Does using AI to write my posts lower my score?
Not on its own. AI-style writing only costs points when another signal backs it up, like an engagement pod or a wall of empty comments.
Is the Favikon Score the same as engagement rate?
No. Engagement rate divides interactions by followers. The Favikon Score compares your median engagements per post with every other creator on the network, then weighs that alongside reach, audience size and consistency.
Others articles