What is a Good Engagement Rate on LinkedIn? A Data-Driven Analysis
This article explains what a good engagement rate on LinkedIn looks like using real data and benchmarks. It breaks down results by follower size, content type, and industry.
.png)
What is a Good Engagement Rate on LinkedIn? A Data-Driven Analysis
Understanding what constitutes a good engagement rate on LinkedIn can be challenging, especially when benchmarks vary dramatically based on account size.
The Overall Landscape
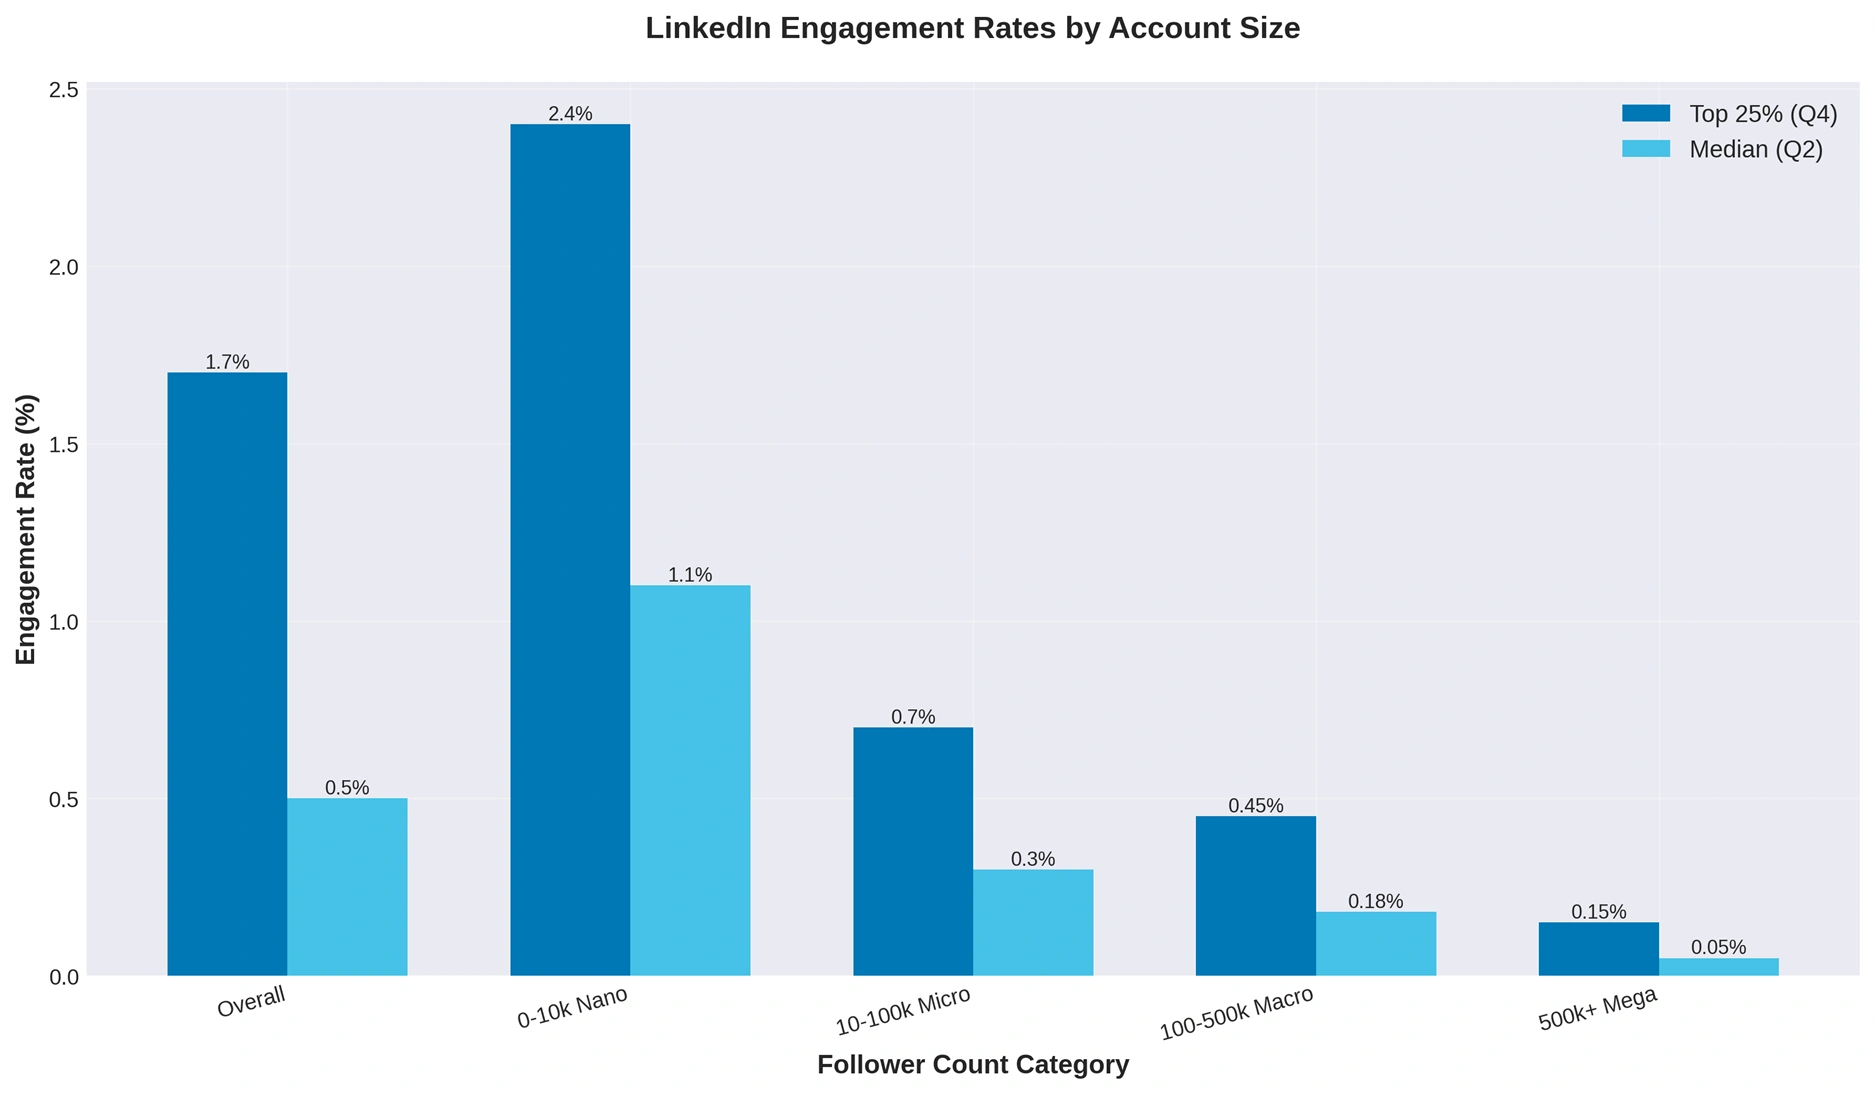
Across all LinkedIn profiles analyzed, the data reveals a striking reality: engagement rates follow a clear quartile distribution. The bottom 25% of accounts (Q1) achieve engagement rates below 0.3%, while the top 25% (Q4) exceed 1.7%. This means that if you're achieving an engagement rate above 1.7%, you're performing in the top quartile of LinkedIn profiles overall.
However, this broad overview masks the most important insight: follower count dramatically impacts what's considered "good" engagement.
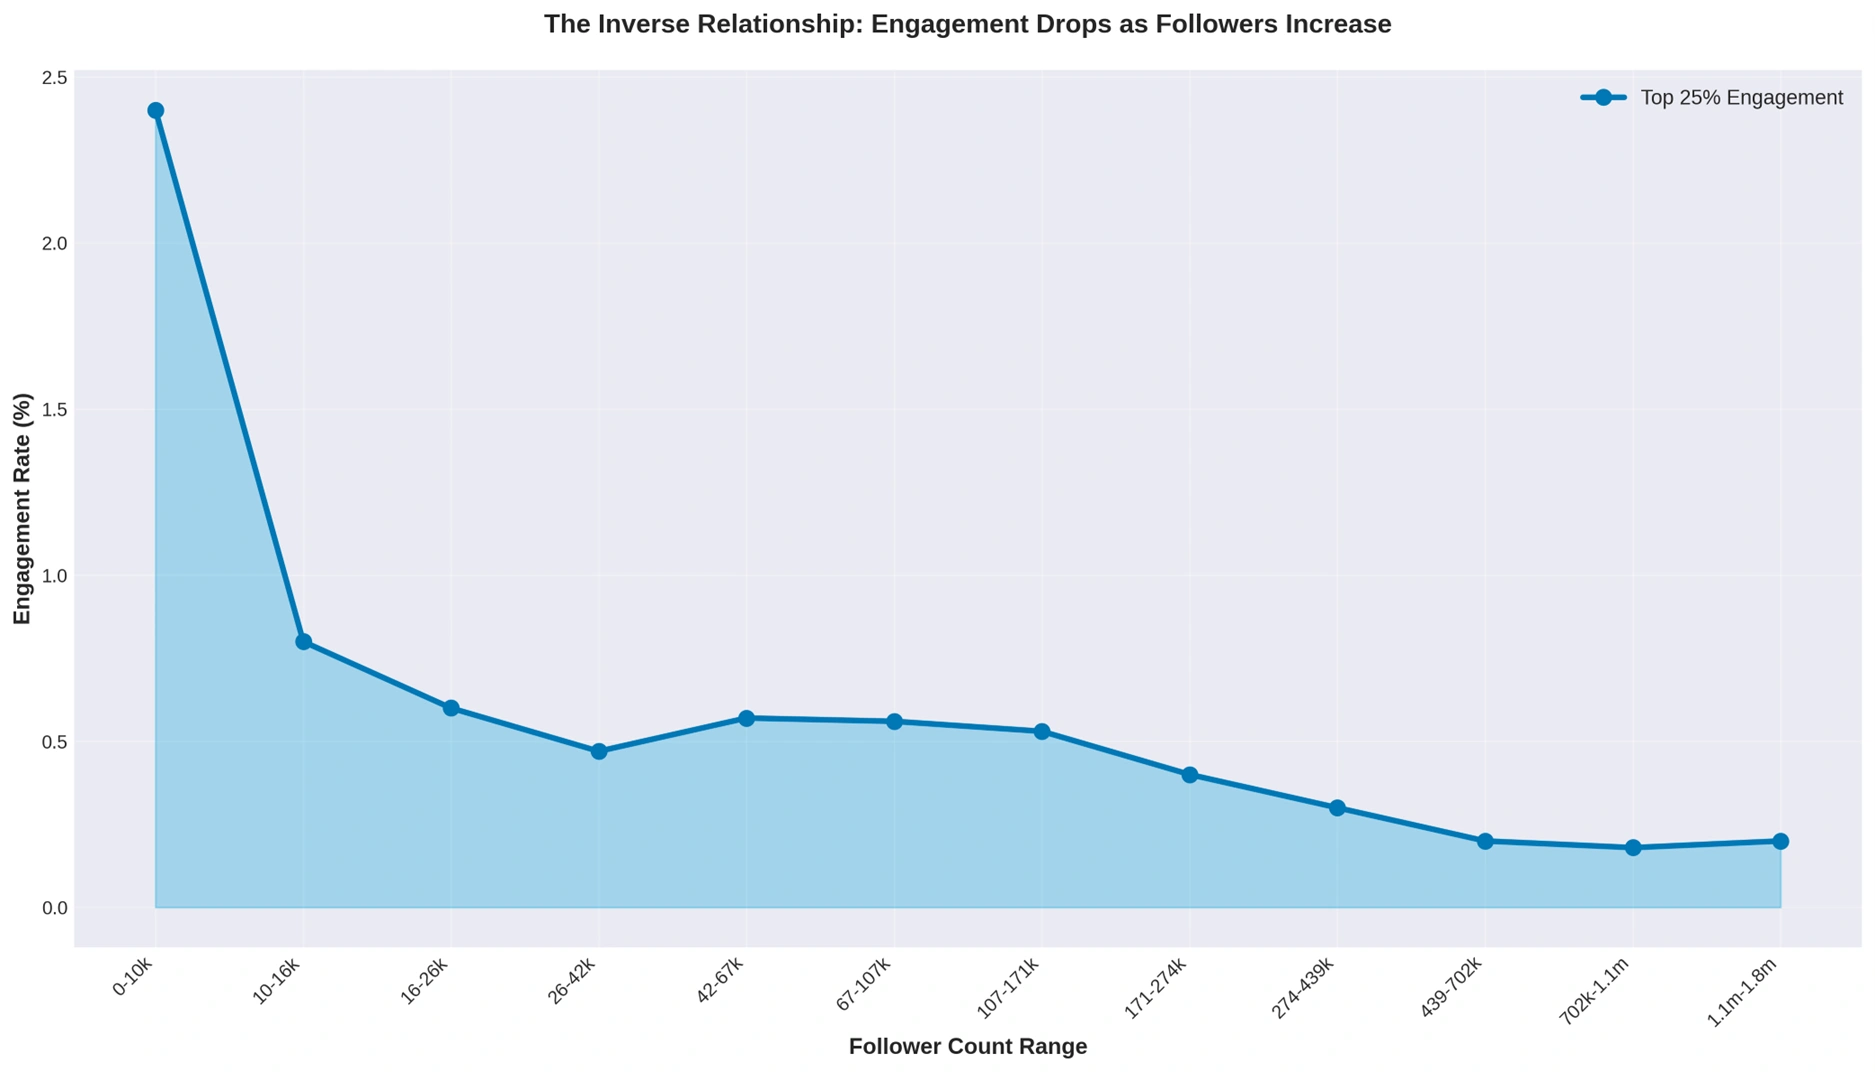
The Inverse Relationship: Size vs. Engagement
The data reveals a consistent inverse relationship between follower count and engagement rate. As accounts grow larger, achieving high engagement rates becomes increasingly difficult. This isn't a failure of strategy; it's a mathematical reality of social media dynamics.
Nano Accounts (0-10k followers)
The Data:
- Total profiles analyzed: 404,958
- Active profiles: 142,728
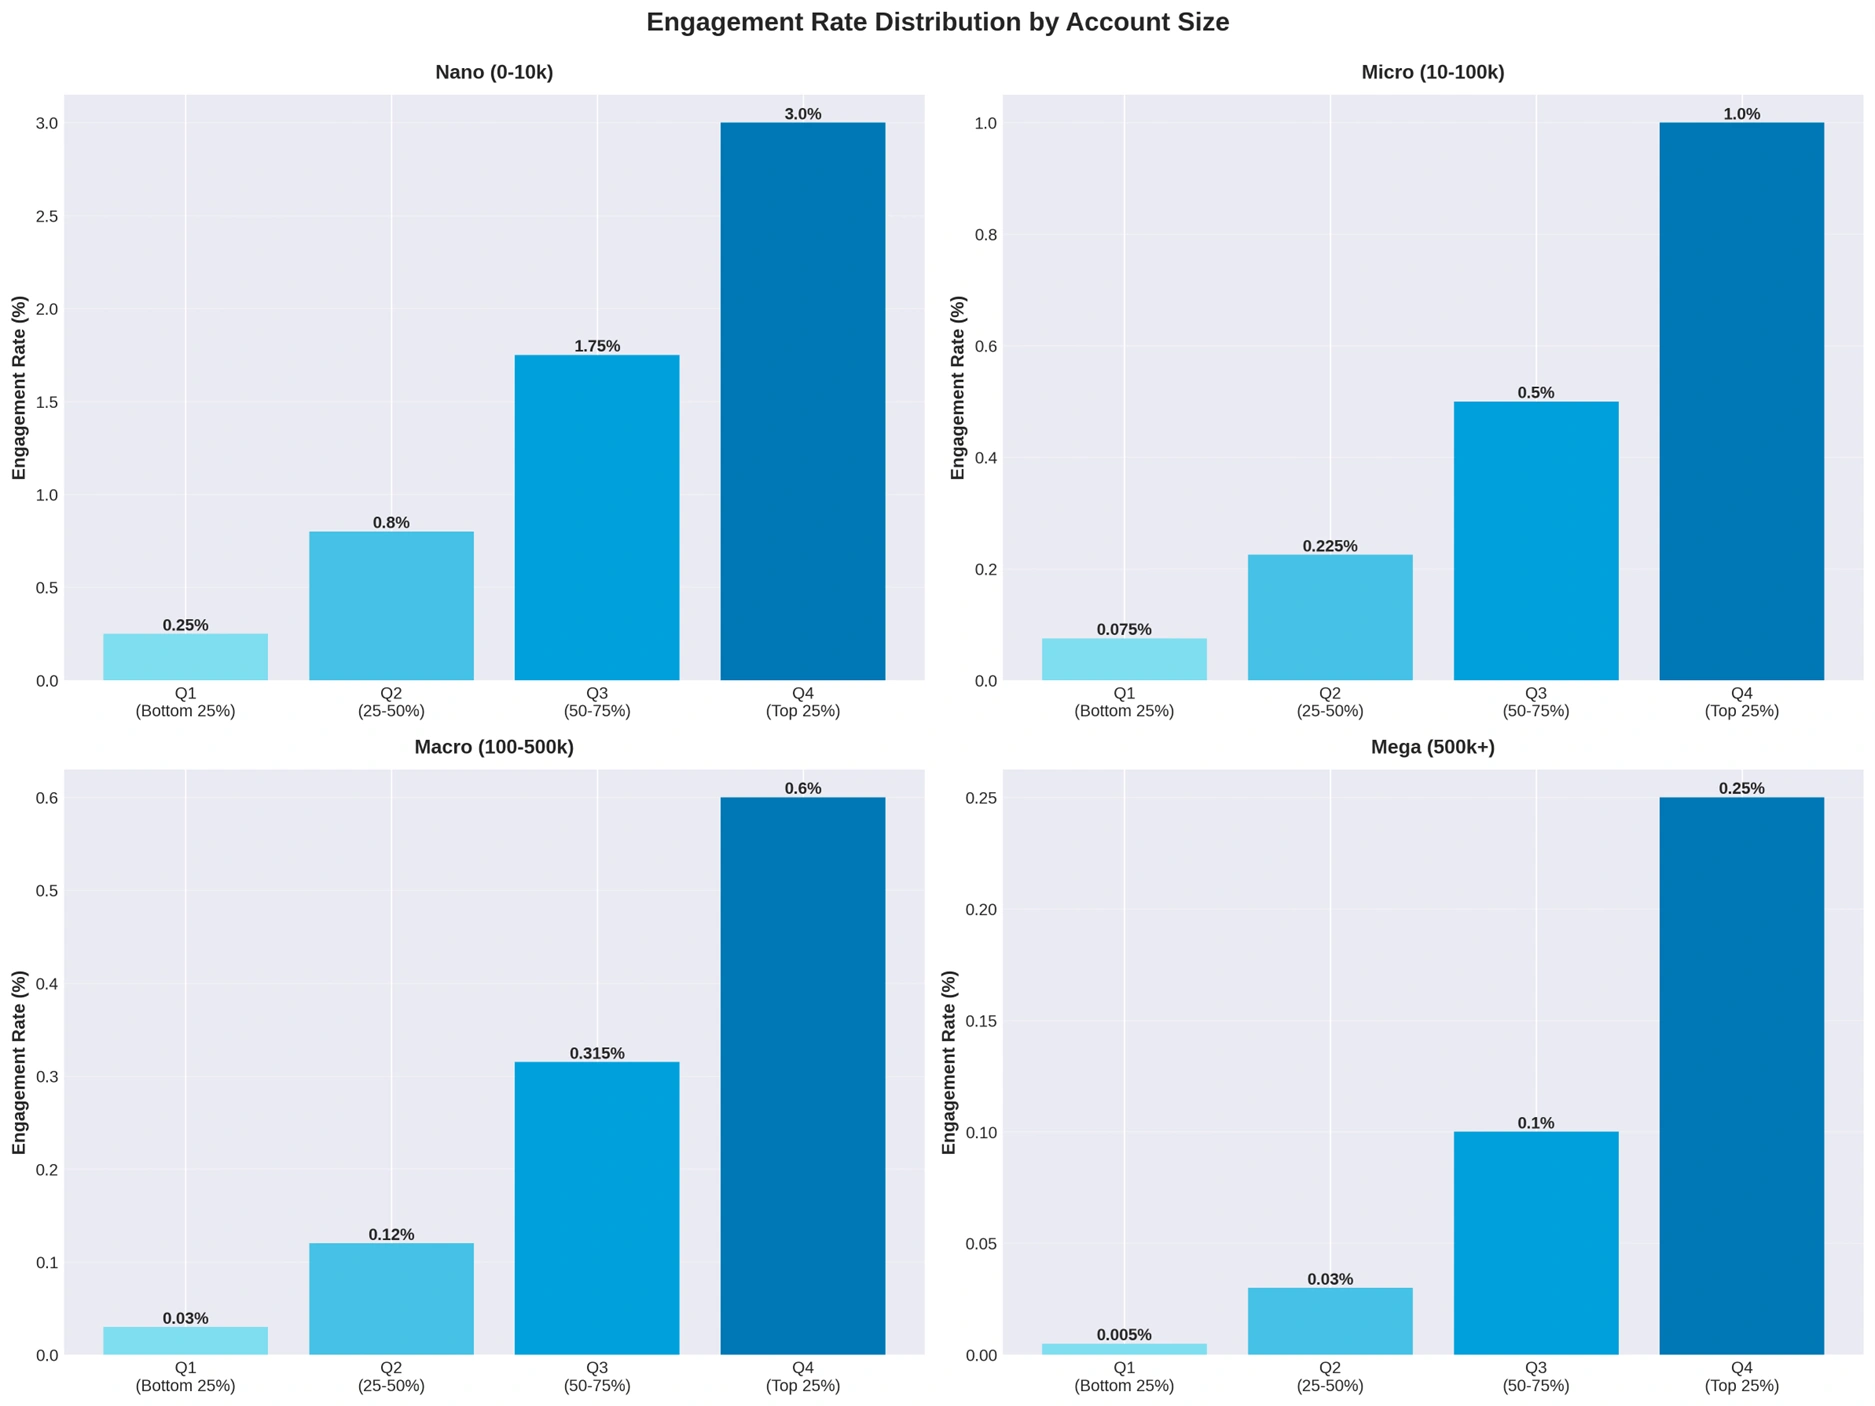
- Q1 (bottom 25%): 0-0.5%
- Q2 (middle-lower): 0.5-1.1%
- Q3 (middle-upper): 1.1-2.4%
- Q4 (top 25%): 2.4%+
Key Insights:
Nano accounts represent the strongest engagement potential on LinkedIn. With over 400,000 profiles analyzed, this category shows that top performers can achieve engagement rates exceeding 2.4%, significantly higher than any other size category.
What makes these accounts powerful is their intimacy. With smaller, more focused audiences, content creators can maintain genuine relationships with their followers. The median engagement rate of 1.1% (Q2 threshold) is achievable for accounts that consistently provide value to their specific niche.
If you're in this category and achieving above 2.4% engagement, you're outperforming 75% of similar-sized accounts. Even hitting 1.1% puts you solidly above the bottom half. The challenge for nano accounts isn't engagement; it's scaling growth while maintaining these rates.
Small to Mid-Range Growth (5k-10k followers)
The Data:
- Total profiles: 80,000
- Active profiles: 41,913
- Q1: 0-0.30%
- Q2: 0.30-0.62%
- Q3: 0.62-1.25%
- Q4: 1.25%+
Key Insights:
This range represents a critical transition point. Accounts here have moved beyond nano status but haven't yet hit the engagement challenges of larger accounts. The top quartile threshold of 1.25%+ is still remarkably strong, nearly half of what nano accounts achieve, but significantly better than what awaits at larger sizes.
The median engagement rate (Q2 threshold at 0.62%) represents a solid performance marker. If you're in this range and maintaining engagement above 1%, you're doing exceptionally well and should focus on maintaining quality over rapid growth.
Micro Influencers (10-100k followers)
The Data:
- Total profiles: 80,686
- Active profiles: 53,188
- Q1: 0-0.15%
- Q2: 0.15-0.3%
- Q3: 0.3-0.7%
- Q4: 0.7%+
Key Insights:
The micro influencer range shows a dramatic drop in engagement rates compared to smaller accounts. The top quartile threshold drops to just 0.7%, less than a third of what nano accounts achieve. This isn't a sign of failure; it's the natural evolution of audience dynamics at scale.
What's particularly interesting is the narrow gap between quartiles. The difference between Q2 and Q3 is just 0.4 percentage points. This suggests that small improvements in content strategy can move you significantly up the rankings when competing at this level.
If you're achieving 0.5% engagement in this range, you're performing above the median, a respectable achievement given the challenges of maintaining engagement at scale. Breaking 0.7% puts you in elite company.
Breaking Down the 10-100k Range
The data provides granular insights within the micro influencer category:
10k-16k followers: Q4 threshold: 0.8%+. This sub-range still maintains relatively strong engagement, with top performers exceeding 0.8%.
16k-26k followers: Q4 threshold: 0.6%+. A noticeable drop occurs here, where even top performers struggle to maintain 1% engagement.
26k-42k followers: Q4 threshold: 0.47%+. The engagement rate continues its downward trajectory, with the median falling to just 0.21% (Q2).
42k-67k followers: Q4 threshold: 0.57%+. Interestingly, this range shows a slight uptick, suggesting that accounts reaching this size may have optimized their content strategy.
67k-107k followers: Q4 threshold: 0.56%+. Engagement stabilizes in the mid-0.5% range for top performers, indicating that accounts mastering this level have found their sustainable engagement rhythm.
Macro Influencers (100-500k followers)
The Data:
- Total profiles: 3,126
- Active profiles: 2,573
- Q1: 0-0.06%
- Q2: 0.06-0.18%
- Q3: 0.18-0.45%
- Q4: 0.45%+
Key Insights:
The macro influencer category represents a significant milestone in LinkedIn presence, but it comes with stark engagement realities. With top performers achieving just 0.45%+ engagement, this category shows how difficult it becomes to maintain meaningful interaction at scale.
The bottom quartile here (0-0.06%) would be considered dismal for smaller accounts, but at this scale,even these numbers represent thousands of engaged followers in absolute terms. An account with 300,000 followers achieving 0.06% engagement still generates 180 interactions per post, more than many nano accounts see in total.
The relatively small number of accounts in this category (3,126 total profiles) indicates its exclusivity. If you've reached this level, you're already in rare company. Focus should shift from percentage-based engagement to absolute engagement numbers and business outcomes.
Detailed Macro Range Analysis:
107k-171k followers: Q4 threshold: 0.53%+. This transition zone shows surprisingly strong engagement for its size, with top performers maintaining above 0.5%.
171k-274k followers: Q4 threshold: 0.4%+. The engagement drop accelerates here, with even top performers struggling to maintain 0.5%.
274k-439k followers: Q4 threshold: 0.3%+. Breaking into the 300k+ follower range means accepting that even exceptional engagement will likely fall below 0.5%.
Mega Influencers (500k+ followers)
The Data:
- Total profiles: 440
- Active profiles: 333
- Q1: 0-0.01%
- Q2: 0.01-0.05%
- Q3: 0.05-0.15%
- Q4: 0.15%+
Key Insights:
The mega influencer category reveals the ultimate challenge of engagement at scale. With just 440 total profiles analyzed, this is the most exclusive tier. Top performers achieve only 0.15%+ engagement, a rate that would be considered poor for any smaller account.
However, context is everything. An account with 1 million followers achieving 0.15% engagement generates 1,500 interactions per post. This absolute number rivals the total reach of many micro influencers. The bottom quartile (0-0.01%) might seem negligible, but fora 2 million follower account, that's still 200 interactions.
What's striking is the narrow margins between quartiles at this level. The gap between Q2 (0.05%) and Q3(0.15%) is just 0.1 percentage points, but at this scale, that difference represents thousands of additional engagements.
Mega Range Breakdown:
439k-702k followers: Q4 threshold: 0.2%+. The transition into mega status shows engagement rates dropping below 0.25% even for top performers.
702k-1.1m followers: Q4 threshold: 0.18%+. Breaking the million-follower mark doesn't come with engagement benefits; rates continue declining.
1.1m-1.8m followers: Q4 threshold: 0.2%+. Interestingly, accounts at this scale show a slight engagement stabilization, possibly due to strong brand loyalty.
What These Numbers Really Mean
The data tells a clear story: engagement rate percentages become less meaningful as follower counts increase. A nano account with 0.5% engagement might be underperforming, while a mega account with the same rate would be dominating its category.
Setting Realistic Benchmarks by Size:
Nano (0-10k): Aim for 1.5%+ to be competitive, 2.4%+ to be exceptional
Micro (10-100k): Target 0.5%+ for solid performance, 0.7%+ for top-tier
Macro (100-500k): Maintain 0.3%+ to stay competitive, 0.45%+ for excellence
Mega (500k+): Preserve 0.1%+ as a baseline, 0.15%+ as a strong benchmark
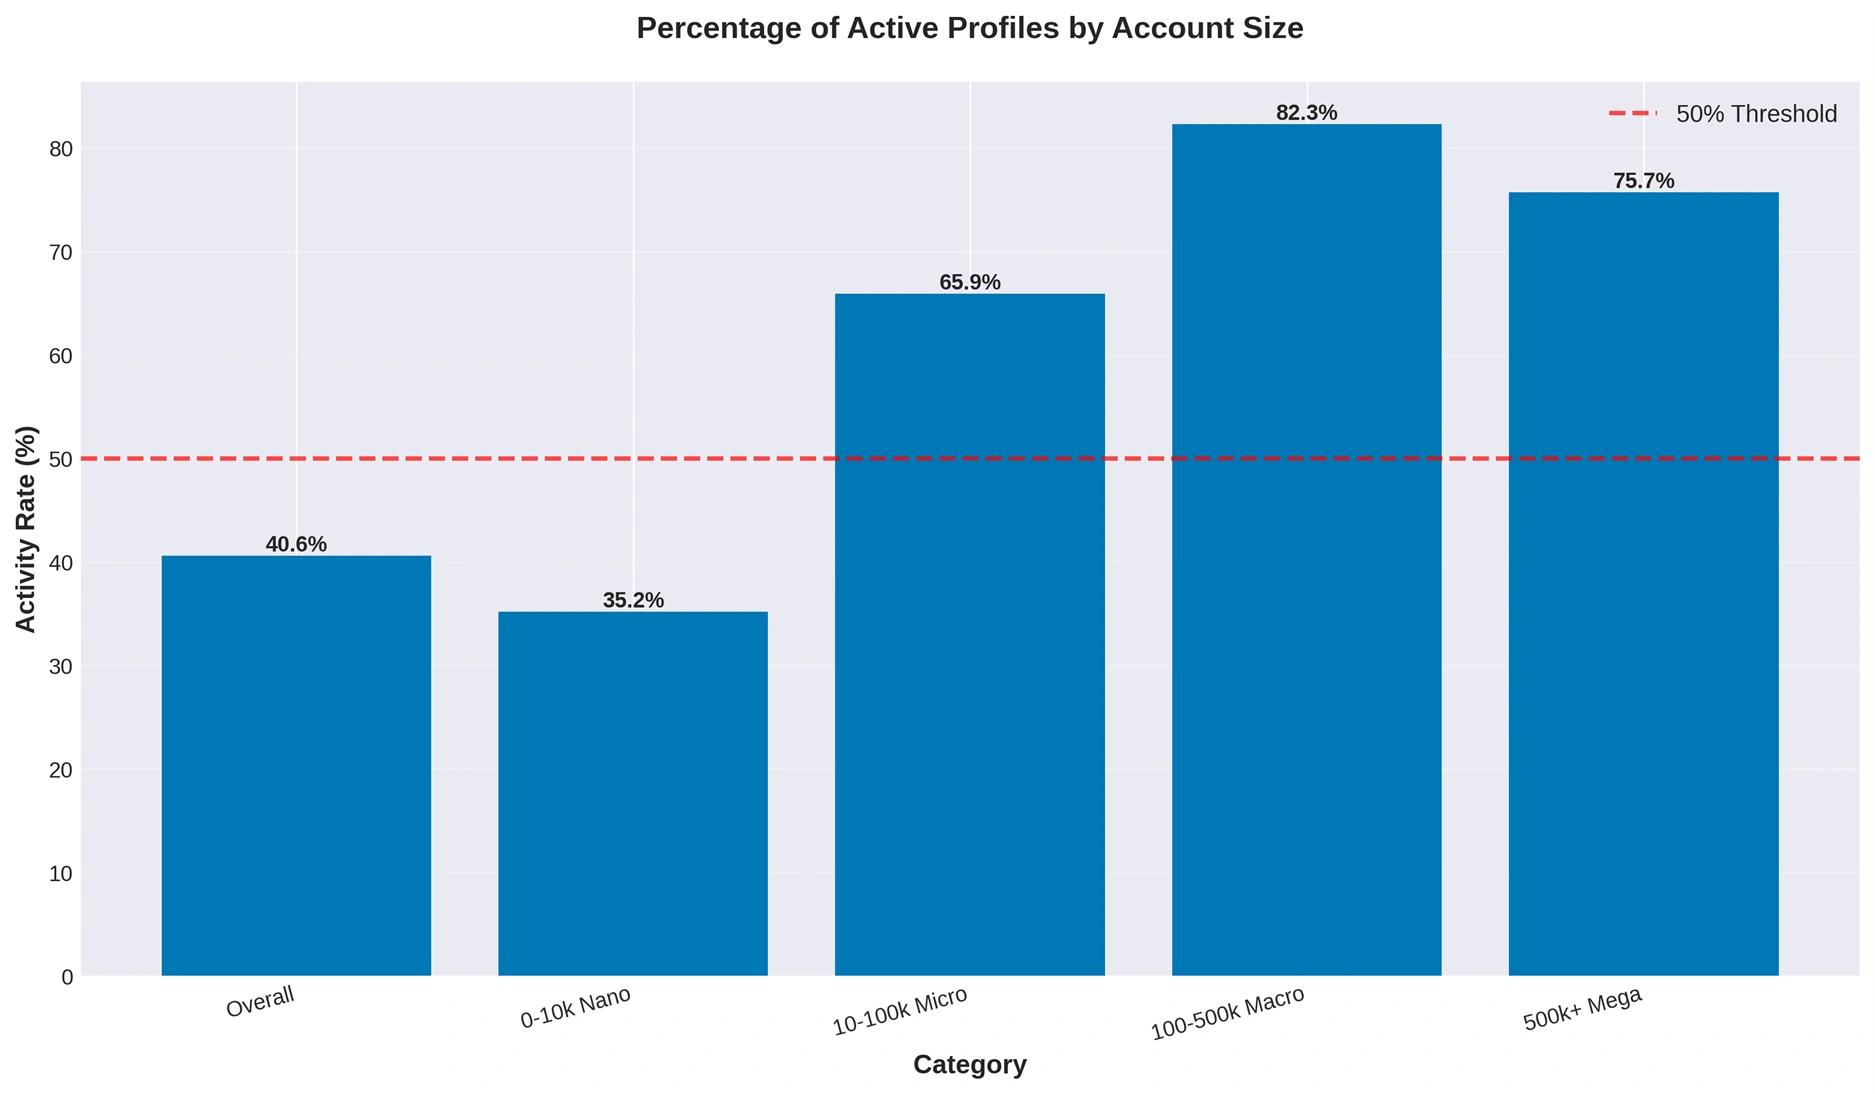
The Activity Gap
One consistent pattern across all categories is the gap between total profiles and active profiles. On average, only about 40-50% of profiles in each category maintain active engagement. This suggests that simply posting consistently already puts you ahead of half your competition.
For instance:
- Of 404,958 nano accounts, only 142,728 (35%) are actively engaging
- Of 80,686 micro accounts, 53,188 (66%) remain active
- Of 440 mega accounts, 333 (76%) maintain activity
The higher activity rates at larger follower counts suggest that accounts that reach scale understand the importance of consistent engagement. Growing large and then going quiet is uncommon. Those who scale understand that maintaining presence is crucial.
Beyond the Percentages: What Really Matters
While these benchmarks provide valuable context, remember that engagement rate is just one metric. The quality of engagement, conversion rates, relationship building, and business outcomes often matter more than hitting a specific percentage.
A nano account with 5,000 highly engaged, relevant followers might drive more business value than a macro account with 250,000 passive followers, even if the percentage rates favor the nano account.
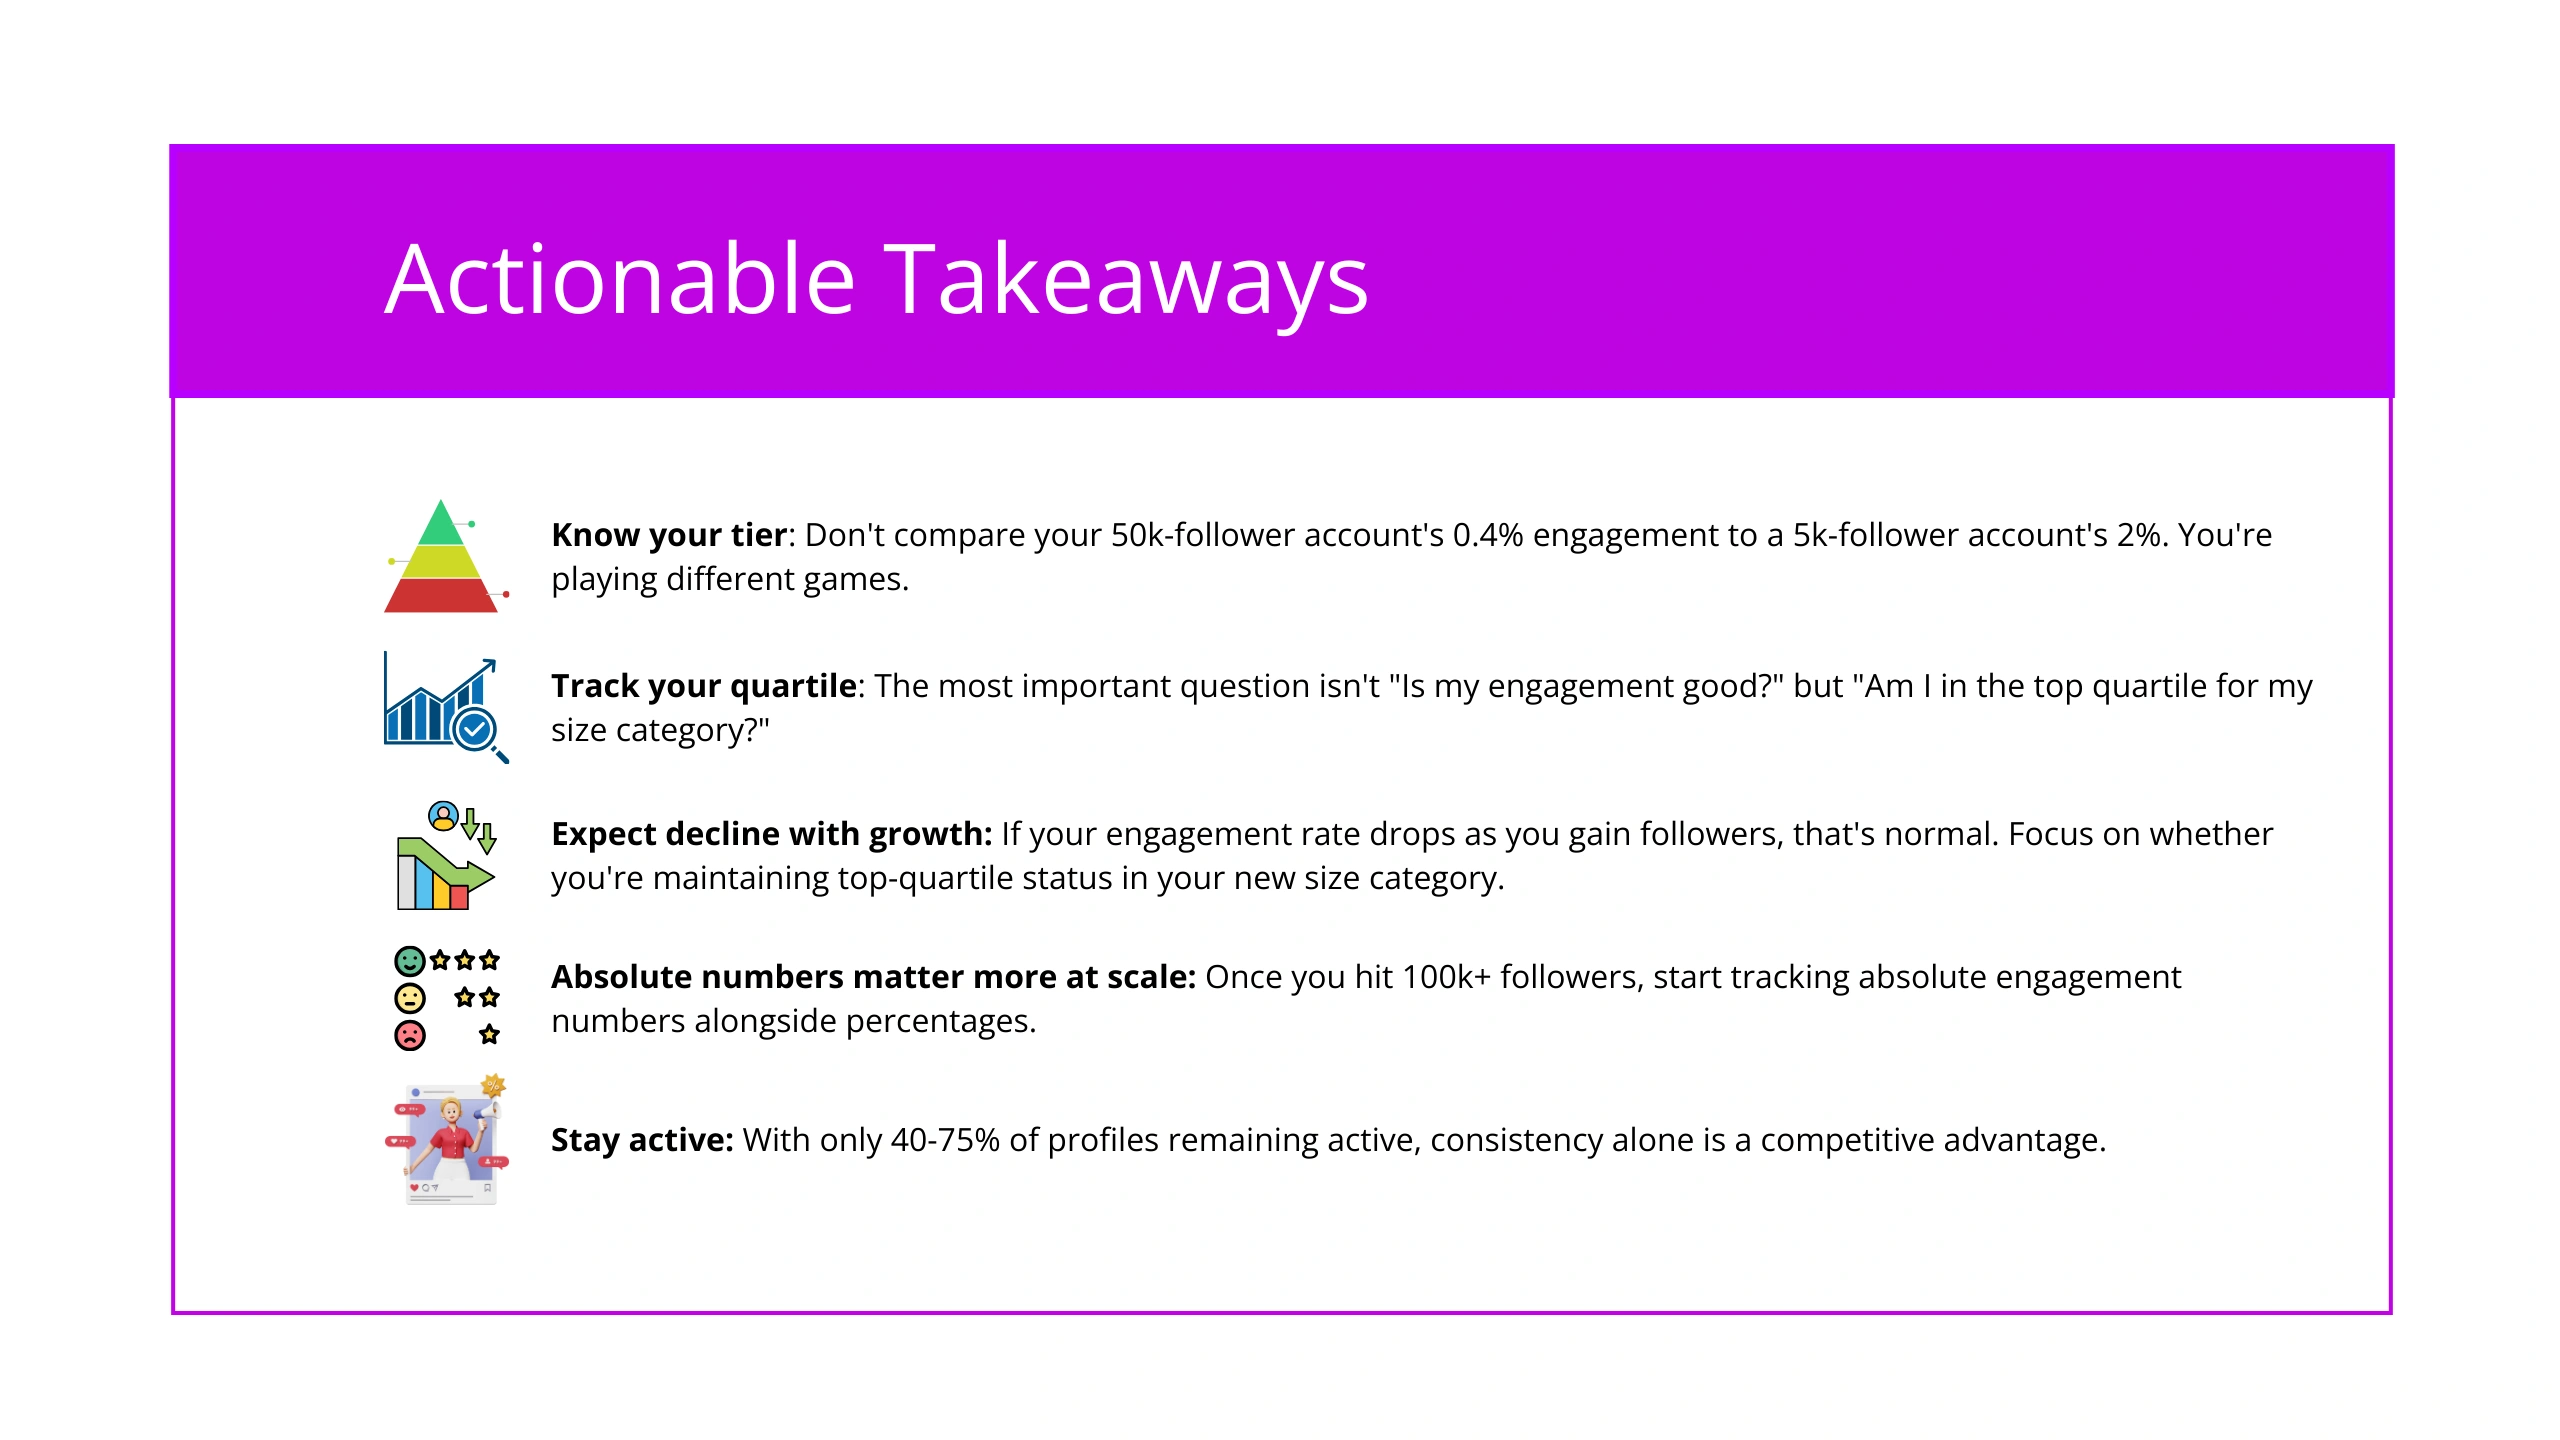
Actionable Takeaways
1. Know your tier: Don't compare your 50k-follower account's 0.4% engagement to a 5k-follower account's 2%. You're playing different games.
2. Track your quartile: The most important question isn't "Is my engagement good?" but "Am Iin the top quartile for my size category?"
3. Expect decline withgrowth: If your engagement rate drops as you gain followers, that's normal. Focus on whether you're maintaining top-quartile status in your new size category.
4. Absolute numbers mattermore at scale: Once you hit 100k+ followers, start tracking absolute engagement numbers alongside percentages.
5. Stay active: With only 40-75% of profiles remaining active, consistency alone is a competitive advantage.
6. Quality compounds: The accounts reaching mega status with 0.15%+ engagement didn't get there by accident. They've optimized every aspect of their content strategy.
Final Thoughts
Good engagement on LinkedIn isn't a single number; it's relative to your account size, your industry, and your specific audience. These benchmarks, drawn from nearly 490,000 profiles, provide a realistic framework for evaluation. Use them not as absolute standards of success, but as guide posts for understanding where you stand and where you can grow.
The most successful LinkedIn creators don't obsess over matching someone else's engagement rate. They focus on consistently delivering value to their specific audience, understanding that sustainable growth comes from genuine connection, not chasing vanity metrics.
Whether you're achieving 3% engagement with 2,000 followers or 0.2% engagement with 800,000 followers, the question remains the same: Are you in the top quartile for your category? If yes, you're doing something right. If not, these benchmarks show you exactly what targets to pursue.
Also See 👀
🏆 BEST MODASH ALTERNATIVE: WHY FAVIKON IS THE SMARTER CHOICE FOR MODERN INFLUENCER MARKETING
🏆 HOW TO TRACK SALES & CONVERSIONS IN INFLUENCER MARKETING IN SAAS
HOW DOES FAVIKON RANK INFLUENCERS?
Others articles
.webp)
.png)


.webp)

